
2-17-20 Weekly Market Update
The very Big Picture:
The long-term valuation of the market is commonly measured by the Cyclically Adjusted Price to Earnings ratio, or “CAPE”, which smooths-out shorter-term earnings swings in order to get a longer-term assessment of market valuation. A CAPE level of 30 is considered to be the upper end of the normal range, and the level at which further PE-ratio expansion comes to a halt (meaning that further increases in market prices only occur as a general response to earnings increases, instead of rising “just because”). The market is currently at that level.
Of course, a “mania” could come along and drive prices higher – much higher, even – and for some years to come. Manias occur when valuation no longer seems to matter, and caution is thrown completely to the wind – as buyers rush in to buy first, and ask questions later. Two manias in the last century – the “Roaring Twenties” of the 1920s, and the “Tech Bubble” of the late 1990s – show that the sky is the limit when common sense is overcome by a blind desire to buy. But, of course, the piper must be paid, and the following decade or two were spent in Secular Bear Markets, giving most or all of the mania-gains back.
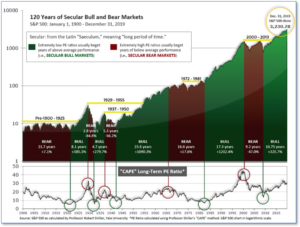
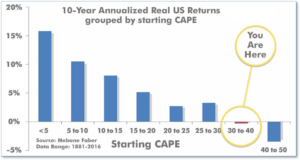
See Fig. 1 for the 100-year view of Secular Bulls and Bears. The CAPE is now at 32.32, up from the prior week’s 31.82, above the level reached at the pre-crash high in October, 2007. Since 1881, the average annual return for all ten-year periods that began with a CAPE around this level have been flat to slightly-negative (see Fig. 2).
The Big Picture:
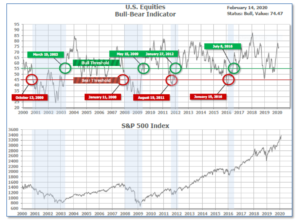
The ‘big picture’ is the (typically) years-long timeframe – the timeframe in which Cyclical Bulls and Bears operate. The U.S. Bull-Bear Indicator (Fig. 1) is in Cyclical Bull territory at 74.47, up from the prior week’s 73.63.
In the Intermediate and Shorter-term Picture:
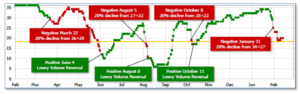
The Shorter-term (weeks to months) Indicator (see Fig. 4) is Negative. The indicator ended the week at 20, up from the prior week at 19. Separately, the Intermediate-term Quarterly Trend Indicator – based on domestic and international stock trend status at the start of each quarter – was positive entering January, indicating positive prospects for equities in the first quarter of 2020.
The Complete Picture:
Counting up the number of all our indicators that are ‘Up’ for U.S. Equities, we are in ‘Mostly Positive’ territory (See Fig 3). This status is drawn from a scale that goes from Negative, to Mostly Negative, to Neutral, to Mostly Positive, to Positive, and totals-up current readings based on a multitude of timeframes (days/weeks/months/quarters/years, the ‘years’ being the Cyclical Bull or Bear reading).
In the Markets:
U.S. Markets: Stocks recorded a second week of solid gains as investors grew more confident that the new coronavirus (officially dubbed “COVID-19”) would be contained. The gains carried the large-cap indexes and the NASDAQ Composite to new record highs, with the latter receiving an extra boost from the continued strong performance of technology stocks. The Dow Jones Industrial Average added 295 points, or 1.0%, finishing the week at 29,398, its second week of gains. The technology-heavy NASDAQ followed last week’s surge with an additional 2.2% gain to 9,731. By market cap, the large cap S&P 500 added 1.6%, while the mid cap S&P 400 and small cap Russell 2000 indexes gained 2.3% and 1.9%, respectively.
International Markets: Canada’s TSX gained 1.1%, while across the Atlantic the United Kingdom’s FTSE 100 finished the week down -0.8%. On Europe’s mainland France’s CAC 40 rose 0.7%, Germany’s DAX gained 1.7%, and Italy’s Milan FTSE finished up 1.6%. China’s Shanghai Composite rebounded 1.4% while Japan’s Nikkei retreated -0.6%. As grouped by Morgan Stanley Capital International, developed markets finished the week up 0.4%, while emerging markets added 1.9%.
Commodities: Precious metals retraced some of last week’s decline. Gold added 0.8%, or $13, to finish the week at $1586.40 per ounce, while Silver rebounded 0.2% to $17.73 per ounce. Oil had its first up week in five, closing up 3.4% to $52.05 per barrel of West Texas Intermediate. The industrial metal copper, viewed by some analysts as a barometer of world economic health due to its wide variety of uses, rose for a second week gaining 1.8%.
U.S. Economic News: The number of Americans seeking first-time unemployment benefits rose slightly in early February, but remained near their lowest levels in 50 years as the economy continues into its record tenth year of expansion. The Labor Department reported initial claims ticked up 2,000 to 205,000. The reading was below economists’ forecast of 211,000. The less volatile monthly average of new claims remained unchanged at 212,000. Meanwhile, continuing claims, which counts the number of people already receiving benefits, fell by 61,000 to 1.69 million. Lewis Alexander, chief U.S. economist at Nomura stated, “Initial unemployment claims have returned to low levels following holiday-related volatility, consistent with our view that the labor market remains strong.”
The Labor Department’s Job Openings and Labor Turnover Survey (JOLTS) reported that the number of job openings in the United States fell to a 2-year low in December. The number of job openings retreated by over 300,000 to 6.42 million at the end of 2019—the second significant decline in a row. Job openings had hit their highest level on record at 7.63 million just a year ago. In the details of the report, job openings declined the most in transportation, warehousing, real estate, and education. Furthermore, the “quits rate”, believed to be closely-watched by the Federal Reserve for the state of the labor market, ticked down to 2.5% in the private sector. Analysts monitor the quits rate for the health of the labor market as it is assumed that one would only quit a job in favor of a more lucrative one.
Small business owners turned more optimistic about sales and profits at the beginning of the year, but they are still struggling to find qualified workers, according to a closely watched survey. The National Federation of Independent Business (NFIB) reported its index of small business optimism rebounded 1.6 points in January to 104.3. For the most part, business owners weren’t concerned about the impeachment trial of President Donald Trump—the gauge that measures uncertainty remained essentially unchanged. The biggest worry of small business owners continued to be the shortage of skilled employees available for hire. A quarter of owners stated it’s their number one problem—more than taxes or regulations. Many reported they’ve had to increase wages and benefits to attract talent.
Sales at the nation’s retailers rose modestly last month as Americans spent more on eating out and furnishing their homes. Retail sales increased 0.3% in January, matching the consensus forecast. Over the past three months, sales were up a steady 0.2%, but slower than the pace in mid-2019. Notably, building materials, garden equipment, and supplies rose 2.1%, the most in five months, while furniture and home furnishings rebounded 0.6%. The advance in these housing-related categories suggests stronger housing demand at the start of the year. On a year-over-year trend basis, retail sales were up 4.4% indicating that despite some weakness, consumer goods spending growth is still robust.
Inflation rose just slightly last month suggesting that the Federal Reserve will have no reason to hike interest rates anytime soon. The Bureau of Labor Statistics reported the Consumer Price Index (CPI) ticked up 0.1% in January, below the consensus of 0.2%. Food prices rose by 0.2%, while energy declined -0.7%–its first downtick in four months. Core CPI, which excludes food and energy, increased by 0.2%. The cost of shelter, medical care services, apparel, and education all increased last month, while the price of drugs and used vehicles fell. Year-over-year, the CPI increased 2.5%–the most since October 2018, but still historically low. Overall, the report shows that consumer price inflation remains subdued, supporting a continued easy monetary policy stance from the Fed.
Federal Reserve Chairman Jerome Powell offered testimony to the House Financial Services Committee this week in which he stated that some of the forces that held back U.S. economic growth last year have eased, but risks to the outlook remain, particularly from the coronavirus. “We are closely monitoring the emergence of the coronavirus, which could lead to disruptions in China that spill over to the rest of the global economy,” Powell said. The U.S. central bank cut interest rates by a quarter percent at three successive meetings last fall, bringing its benchmark rate down to a range of 1.5-1.75%. Powell stated that he believed the current accommodative stance of policy was still appropriate to support growth, but stated, “If developments emerge that cause a material reassessment of our outlook, we would respond accordingly.”
International Economic News: Canadian National Railway said it was forced to temporarily shut down part of its network as anti-pipeline protestors are too close to the tracks for trains to pass. The disruption in rail service is having a significant impact on some Canadian industries costing millions of dollars, industry leaders say. “Every day that it goes on, the damage compounds,” said Perrin Beatty, CEO of the Canadian Chamber of Commerce and former Conservative MP. Anti-pipeline protesters who are demonstrating around the rail lines near Belleville, Ont., and New Hazelton, B.C., have prompted CN Rail to temporarily shut down parts of its network, the railway said in a statement. There is currently no movement of any trains — freight or passenger — at both those locations, crippling the ability to move goods and facilitate trade. “A rail disruption of this magnitude constitutes an emergency for the Canadian economy,” wrote Beatty.
Despite the incessant predictions by major international economic think tanks that Britain’s anticipated departure from the European Union would lead to economic collapse, Britain actually had the fastest growing European economy in the G7 group of advanced nations last year. While economic growth stagnated in the fourth quarter, figures showed that Britain’s economy grew by 1.4% last year. According to the UK’s Office for National Statistics, the 1.4% annual growth rate meant that Britain was behind only the U.S. and Canada, which posted 2.2% and 1.5% growth respectively.
In a boost to President Emmanuel Macron, French unemployment hit its lowest level since the financial crisis. France’s jobless rate fell to 8.1% in the fourth quarter of last year, its lowest level in 11 years. Furthermore, unemployment dropped by 85,000 to 2.4 million—a bigger decline than expected. Excluding overseas territories, the unemployment rate fell to 7.9%. France’s Finance Minister Bruno Maire stated, “I’m delighted because it’s a decisive success for France, and it’s a decisive success for the economic policies that we have been implementing now for nearly three years.” Notable measures that were introduced included tightening generous unemployment benefits, lowering the burden of tax and social security costs for low-paid workers, launching training and apprenticeship programs, and promoting long-term contracts rather than temporary jobs.
Germany reported that it registered zero economic growth in the final three months of 2019, driven in part by continued weakness in the manufacturing sector. The country’s economists had expected a modest rise. Now economists are once again talking about the prospect of a recession, defined as two consecutive quarters of negative growth. Germany relies heavily on exports to China, whose economy has been paralyzed by the coronavirus outbreak. Carsten Brzeski, chief German economist at ING told clients, “The impact from the coronavirus on the Chinese economy is likely to delay any rebound in the [German] manufacturing sector as it at least temporarily disrupts supply chains. Stagnation, with a risk of a technical recession, currently looks like the only dish served,” he stated.
The economic impact from China’s coronavirus epidemic is being felt far and wide as Asian and European auto plants run short of parts, free-spending Chinese tourists are staying home, and American companies brace for almost certain supply disruptions. That’s just the start of the problems, economists and supply chain experts say. The Chinese epidemic’s aftereffects will likely cause the global economy to shrink into contraction this quarter for the first time since the depths of the 2009 financial crisis, according to London-based Capital Economics. Chinese factories had been scheduled to reopen on Monday, however with many workers either unable or unwilling to return to workplaces, the resumption of routine operations has been delayed. As of February 14, more than 64,000 cases of coronavirus have been confirmed with over 1,300 deaths.
Japan’s economy likely suffered its biggest contraction since 2014 in the final quarter of last year, as fallout from China’s viral outbreak threatened to turn Japan’s one-quarter-slump into a recession. Economists noted a tax hike and typhoons in the fourth quarter of last year likely pushed Japan’s economy into recession. Analysts are now concerned the coronavirus could derail the weak recovery forecast for the early this year. Hiroshi Miyazaki, an economist at Mitsubishi UFJ Morgan Securities stated, “Japan’s underlying economy isn’t on a firm footing to start with, so growth can be easily pushed into negative territory if something like the coronavirus happens.” Miyazaki is forecasting a 7.5% decline.
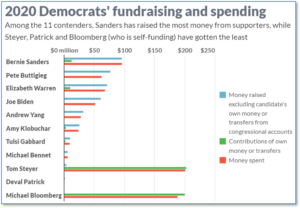
Finally: When billionaires Michael Bloomberg and Tom Steyer threw their names in the hat for the Democratic nomination for president of the United States, most probably expected they would spend some of their own money in the pursuit of the nomination. But few expected how they would bury the race in their own money. To date, Steyer and Bloomberg have each spent nearly $200 million, each more than double Democratic contender Bernie Sanders, and each more than three times Elizabeth Warren and Joe Biden. All that money doesn’t seem to have done much for Tom Steyer, but Bloomberg’s omnipresent advertising in critical markets has propelled him higher in the polls steadily. (Chart from Marketwatch.com)
(Sources: All index- and returns-data from Yahoo Finance; news from Reuters, Barron’s, Wall St. Journal, Bloomberg.com, ft.com, guggenheimpartners.com, zerohedge.com, ritholtz.com, markit.com, financialpost.com, Eurostat, Statistics Canada, Yahoo! Finance, stocksandnews.com, marketwatch.com, wantchinatimes.com, BBC, 361capital.com, pensionpartners.com, cnbc.com, FactSet) Securities offered through Registered Representatives of Cambridge Investment Research Inc., a broker-dealer, member FINRA/SIPC. Advisory Services offered through Cambridge Investment Research Advisors, a Registered Investment Adviser. Strategic Investment Partners and Cambridge are not affiliated.
Indices mentioned are unmanaged and cannot be invested into directly. Past performance is no guarantee of future results. All Investing involves risk. Depending on the types of investments, there may be varying degrees of risk. Investors should be prepared to bear loss, including total loss of principal.