
2-24-20 Weekly Market Update
The very Big Picture:
The long-term valuation of the market is commonly measured by the Cyclically Adjusted Price to Earnings ratio, or “CAPE”, which smooths-out shorter-term earnings swings in order to get a longer-term assessment of market valuation. A CAPE level of 30 is considered to be the upper end of the normal range, and the level at which further PE-ratio expansion comes to a halt (meaning that further increases in market prices only occur as a general response to earnings increases, instead of rising “just because”). The market is currently at that level.
Of course, a “mania” could come along and drive prices higher – much higher, even – and for some years to come. Manias occur when valuation no longer seems to matter, and caution is thrown completely to the wind – as buyers rush in to buy first, and ask questions later. Two manias in the last century – the “Roaring Twenties” of the 1920s, and the “Tech Bubble” of the late 1990s – show that the sky is the limit when common sense is overcome by a blind desire to buy. But, of course, the piper must be paid, and the following decade or two were spent in Secular Bear Markets, giving most or all of the mania-gains back.
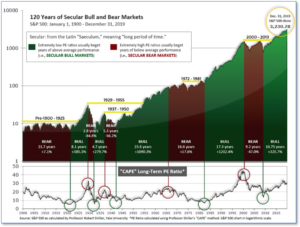
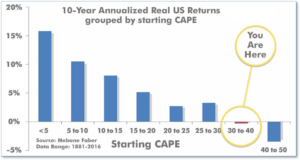
See Fig. 1 for the 100-year view of Secular Bulls and Bears. The CAPE is now at 31.44, down from the prior week’s 32.32, above the level reached at the pre-crash high in October, 2007. Since 1881, the average annual return for all ten-year periods that began with a CAPE around this level have been flat to slightly-negative (see Fig. 2).
The big Picture:
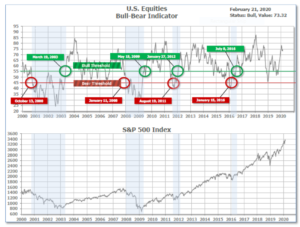
The ‘big picture’ is the (typically) years-long timeframe – the timeframe in which Cyclical Bulls and Bears operate. The U.S. Bull-Bear Indicator (Fig. 1) is in Cyclical Bull territory at 73.32, down from the prior week’s 74.47.
In the Intermediate and Shorter-term Picture:
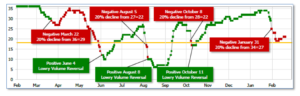
The Shorter-term (weeks to months) Indicator (see Fig. 4) is Negative. The indicator ended the week at 21, up from the prior week at 20. Separately, the Intermediate-term Quarterly Trend Indicator – based on domestic and international stock trend status at the start of each quarter – was positive entering January, indicating positive prospects for equities in the first quarter of 2020.
The complete Picture:
Counting up the number of all our indicators that are ‘Up’ for U.S. Equities, we are in ‘Mostly Positive’ territory (See Fig 3). This status is drawn from a scale that goes from Negative, to Mostly Negative, to Neutral, to Mostly Positive, to Positive, and totals-up current readings based on a multitude of timeframes (days/weeks/months/quarters/years, the ‘years’ being the Cyclical Bull or Bear reading).
In the Markets:
U.S. Markets: Stocks ended the week lower as worries grew about the impact of the coronavirus outbreak on the global economy. The S&P 500 index and the technology-heavy NASDAQ Composite reached record highs this week before falling back, but it was the smaller-cap benchmarks that held up best this week. The Dow Jones Industrial Average gave up 405 points to finish the week at 28,992, a decline of -1.4%. The Nasdaq Composite retreated -1.6%, while the S&P 500 finished down -1.3%. The small-cap Russell 2000 and mid-cap S&P 400 indexes retreated -0.5% and -0.6%, respectively.
International Markets: The vast majority of international markets finished the week down as well. Canada’s TSX and the United Kingdom’s FTSE each closed down less than -0.1%, while on Europe’s mainland France’s CAC 40 fell -0.7%, Germany’s DAX retreated -1.2%, and Italy’s Milan FTSE lost -0.4%. In Asia, China’s Shanghai Composite surged 4.2% in a partial rebound from earlier losses, while Japan’s Nikkei declined -1.3%. As grouped by Morgan Stanley Capital International, developed markets gave up -1.4%, while emerging markets ended down -2.1%.
Commodities: Precious metals surged higher this week. Gold rose for a second consecutive week, rising $62.40 to $1648.80 an ounce, a gain of 3.9%. Silver rose 4.5% to $18.53 per ounce. Oil finished the week up as well, closing at $53.38 per barrel of West Texas Intermediate crude, a gain of 2.6%. The industrial metal copper, seen by some analysts as a barometer of global economic health due to its wide variety of uses, rose a third consecutive week, up 0.3%. The rise in copper is a bit of a conundrum, as most fear worsening global economic health which would ordinarily pressure copper lower.
U.S. Economic News: The number of Americans claiming first-time unemployment benefits rose slightly, but remained near post-recession lows. The Labor Department reported initial jobless claims edged up by 4,000 to 210,000 last week. The reading matched economists’ forecasts. The more stable monthly average of new claims, which filters out the often‑volatile weekly number, slipped by 3,250 to 209,000 – its lowest reading since last April. Meanwhile, the number of people already collecting unemployment benefits, known as “continuing claims”, rose by 25,000 to 1.73 million. That number had soared as high as 6.6 million near the end of the 2007-2009 Financial Crisis.
Confidence among the nation’s homebuilders remained near all-time highs despite growing concerns that first-time homebuyers may be weighed down by excessive debt. The National Association of Home Builders reported its monthly confidence index dropped one point to 74 this month. The reading is just two points below the index’s highest reading since June of 1999. Mortgage rates have hit a three-year low, propping up the housing market, but analysts note that many potential buyers are saddled with student loan debt. Rubeela Farooqi, chief U.S. economist at High Frequency Economics stated “Student loans remain high and present an obstacle in first time buyers’ ability to save for a down payment.”
Sales of previously-owned homes dipped in January, but the overall trend remains up. The National Association of Realtors reported existing-home sales slipped 1.3% last month to an annual pace of 5.46 million. Yet that number is still 10% higher than at the same time last year. Sales were off more than 9% in the West, accounting for last month’s entire decline. In the South and Midwest sales rose slightly, and in the Northeast sales were flat. The median sales price was $266,300—up 6.8% from a year earlier.
There was just a 3.1 month supply of homes for sale last month, far below the 6-month supply that is generally considered a “balanced” housing market.
The number of new homes under construction dipped in January, but an indicator of future building activity remained resilient. The Commerce Department reported housing starts slipped -3.6% following a remarkably strong showing at the end of 2019. Housing starts fell to an annual pace of 1.57 million, exceeding economists’ forecasts of a 1.43 million rate. Building permits, which analysts use to gauge future building activity, rose 9.2% to a nearly 13-year high. Both starts and permits are sharply higher compared to the same time last year, reflecting the rebound in the housing market tied to lower interest rates.
Manufacturing activity in the New York-area surged this month to its highest level in nine months, the Federal Reserve reported. The NY Fed’s Empire State Manufacturing Index rose 8.1 points to 12.9—its highest reading since last May. Economists had expected a reading of just 4.0. Readings above 0 indicate improving conditions. In the details, the new orders index rose to its highest level in over a year, up 15.5 points, while the shipments index also had a strong gain. The index of future business conditions remained little-changed at 22.9. T.J. Connelly, head of research at Contingent Macro stated, “Phase One of the U.S./China trade deal appears to have eased uncertainty and helped a rebound in activity after several quarters of slow business.”
It was a similar story in the mid-Atlantic region. The Philadelphia Fed reported its manufacturing index jumped to its highest level in three years this month. The regional Fed bank’s index jumped to 36.7 this month, up 20 points from January. Readings above zero indicate improving conditions. Economists had expected a reading of just 10. In the details, new orders increased 15 points to its highest level since May 2018 and the shipments index rose 2 points to 25.2. The measure of six-month business outlook rose 7 points to 45.4—its fifth consecutive month of improvement.
Federal Reserve officials remained upbeat about the economic outlook for the remainder of the year, according to meeting minutes released this week. Officials expressed concerns about the threat of the coronavirus outbreak in China and rising tensions in the Middle East. Fed Chairman Jerome Powell told Congress last week that the central bank was “carefully monitoring” COVID-19, the deadly virus that is hampering the production of goods in China, especially those for U.S. technology firms. Analysts were surprised by the “cautious optimism” expressed about the business sector, which remained mostly stagnant last year. There was also some optimism about the outlook for inflation, which has lagged below the Fed’s 2% target. Despite the optimism, Fed officials were careful not to signal any change in interest rates.
International Economic News: Rocco Rossi, president and CEO of the Ontario Chamber of Commerce said this week that so far, the outbreak of the coronavirus has so far “had a minimal effect on both the Canadian and Ontario economies.” However, given the length of the supply chain cycles, he noted that the full impact of the disruption won’t be known for some months. In cases where Canada sells raw materials to China where they are processed and the finished goods are shipped back, business has already slowed. Jim Danahy, CEO of CustomerLAB, a retail consulting firm in Toronto stated, “It’s going to be a double-whammy whose impact will be measured at least in months, maybe longer.”
Across the Atlantic, UK Prime Minister Boris Johnson got an early vote of confidence in his leadership of the economy. Multiple indicators from inflation to retail sales all confirmed signs of a “Boris Bounce”—a term coined following the Conservative party’s decisive election win. Citigroup’s measure of the strength of the economic data relative to forecasts hit its highest level since early 2019. The pickup in activity also vindicates of the Bank of England’s decision to refrain from cutting interest rates last month. Economists note the better economic picture likely means the Bank of England will have the latitude to leave interest rates alone this year.
On Europe’s mainland, despite U.S. tariffs and concerns over Britain’s exit from the European Union, exports from France hit a new record in 2019. In particular, overseas sales of wines and spirits rose 5.9% to a record $15.3 billion, according to Antoine Leccia, President of the Federation of French Wines and Spirit Exporters. However, Leccia noted the increase in sales was likely in anticipation of heightened trade tensions and that “2020 will be a challenging year.” Wines and spirits are France’s second-biggest export after aerospace.
Germany is in the midst of another economic crisis after a major Munich-based company cut hundreds of jobs. Machine builder KraussMaffei has announced they intend to slash hundreds of jobs across the entire European Union, with most of the cuts in Germany. The job cuts come as Berlin struggles with its steepest drop in industrial production since the financial crisis of 2009. Germany’s Federal Ministry of Economics said: “The recent weak development in production and incoming orders indicates that the economic downturn in industry has not yet been overcome.”
In Asia, China’s central bank announced it will take even more steps to support the virus-hit economy. Liu Guoqiang, vice governor of the bank, stated along with releasing more liquidity and lowering funding costs for companies, the People’s Bank of China would guide market interest rates lower. “China’s monetary policy space is still very sufficient, and the toolbox is also sufficient. We are confident and able to offset the impact of the epidemic,” Liu stated. The virus and widespread transportation lockdowns put in place to contain it have caused significant disruptions to economic activity in China. Given the stimulus already in place, Liu reiterated that the central bank will not resort to “flood-like” stimulus.
At a time when the country should be gearing up for the mass celebration of its first Summer Olympics since 1964, Japanese Prime Minister Shinzo Abe and his cabinet are battling criticism both from within and outside Japan over how they’ve dealt with the coronavirus outbreak. In particular, critics point out the apparent mishandling of the Diamond Princess, a cruise ship stuck in quarantine off the coast of Japan as growing numbers of its 3,700 passengers and crew fell sick. Japan’s economy contracted 6.3% in the last quarter of 2019, after an Oct. 1 sales tax hike dented demand at a time when exports already were languishing thanks to the China-U.S. trade war. Michael Cucek, assistant professor for Asian Studies at Temple University in Tokyo stated, “A multitude of things are going wrong simultaneously, not just for Abe but for Japan as a whole.”
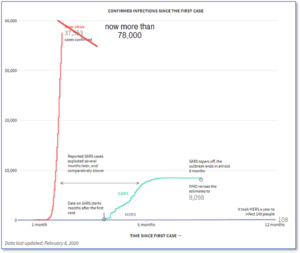
Finally: By now almost everyone is aware of the coronavirus outbreak first detected in China and now known as “COVID-19”. The latest data (2/23/20) from Johns Hopkins University, which has been monitoring the situation closely, shows 78,990 confirmed cases worldwide, with 2,469 deaths. An under-appreciated facet of this virus is the stunningly high rate of transmission, as illustrated by the nearly-vertical line on the chart below. The extremely high velocity of transmission from person to person is perhaps the most frightening characteristic of this new killer. Chart from Reuters.
(Sources: All index- and returns-data from Yahoo Finance; news from Reuters, Barron’s, Wall St. Journal, Bloomberg.com, ft.com, guggenheimpartners.com, zerohedge.com, ritholtz.com, markit.com, financialpost.com, Eurostat, Statistics Canada, Yahoo! Finance, stocksandnews.com, marketwatch.com, wantchinatimes.com, BBC, 361capital.com, pensionpartners.com, cnbc.com, FactSet) Securities offered through Registered Representatives of Cambridge Investment Research Inc., a broker-dealer, member FINRA/SIPC. Advisory Services offered through Cambridge Investment Research Advisors, a Registered Investment Adviser. Strategic Investment Partners and Cambridge are not affiliated.
Indices mentioned are unmanaged and cannot be invested into directly. Past performance is no guarantee of future results. All Investing involves risk. Depending on the types of investments, there may be varying degrees of risk. Investors should be prepared to bear loss, including total loss of principal.