
2-7-2022 Weekly Market Update
The very Big Picture
The long-term valuation of the market is commonly measured by the Cyclically Adjusted Price to Earnings ratio, or “CAPE”, which smooths-out shorter-term earnings swings in order to get a longer-term assessment of market valuation. A CAPE level of 30 is considered to be the upper end of the normal range, and the level at which further PE-ratio expansion comes to a halt (meaning that further increases in market prices only occur as a general response to earnings increases, instead of rising “just because”). The market is now above at that level.
Of course, a “mania” could come along and drive prices higher – much higher, even – and for some years to come. Manias occur when valuation no longer seems to matter, and caution is thrown completely to the wind – as buyers rush in to buy first, and ask questions later. Two manias in the last century – the “Roaring Twenties” of the 1920s, and the “Tech Bubble” of the late 1990s – show that the sky is the limit when common sense is overcome by a blind desire to buy. But, of course, the piper must be paid, and the following decade or two were spent in Secular Bear Markets, giving most or all of the mania-gains back.
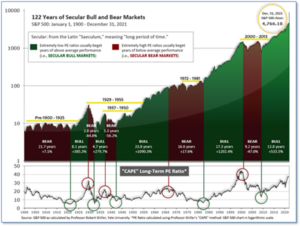
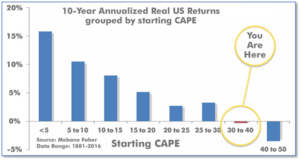
See Fig. 1 for the 100-year view of Secular Bulls and Bears. The CAPE is now at 37.18, up from the prior week’s 36.61. Since 1881, the average annual return for all ten-year periods that began with a CAPE in this range has been negative (see Fig. 2).
Note: We do not use CAPE as an official input into our methods. However, if history is any guide – and history is typically ‘some’ kind of guide – it’s always good to simply know where we are on the historic continuum, where that may lead, and what sort of expectations one may wish to hold in order to craft an investment strategy that works in any market ‘season’ … whether the current one, or one that may be ‘coming soon’!
The Big Picture:
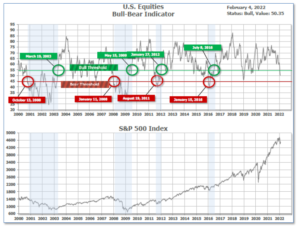
The ‘big picture’ is the (typically) years-long timeframe – the timeframe in which Cyclical Bulls and Bears operate. The U.S. Bull-Bear Indicator is in Cyclical Bull territory at 50.35, down slightly from the prior week’s 50.50.
In the Quarterly- and Shorter-term Pictures
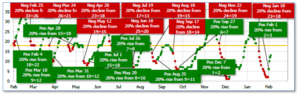
The Quarterly-Trend Indicator based on the combination of U.S. and International Equities trend-statuses at the start of each quarter – was Positive entering January, indicating positive prospects for equities in the fourth quarter of 2021.
Next, the short-term(weeks to months) Indicator for US Equities turned positive on February 1, and ended the week at 13, up from the prior week’s 2.
In the Markets:
U.S. Markets: U.S. equity markets remained volatile but recorded overall gains for the second consecutive week. Breaking with its pattern of value outperforming growth since November, growth and value shares performed similarly and mid and small-caps outperformed large caps. The Dow Jones Industrial Average added 364 points last week closing at 35,090—a gain of 1.0%. The technology-heavy NASDAQ rose 2.4% to 14,098. By market cap, the large cap S&P 500 added 1.5%, while the mid-cap S&P 400 and small-cap Russell 2000 each added 1.7%.
International Markets: International markets finished the week mixed. Canada’s TSX rose 2.6% while the United Kingdom’s FTSE 100 tacked on 0.7%. France’s CAC 40 ticked down -0.2% and Germany’s DAX shed -1.4%. In Asia, China’s Shanghai Composite remained closed for the week for the Chinese New Year. Japan’s Nikkei finished the week up 2.7%. As grouped by Morgan Stanley Capital International, developed markets rose 1.8%, while emerging markets rebounded 2.9%.
Commodities: Commodities continued their rally. Precious metals finished the week in the green with Gold rising 1.2% to $1807.80 per ounce and Silver adding 0.8% to $22.48. West Texas Intermediate crude oil rose for a seventh consecutive week rising 6.3% to $92.31 per barrel. The industrial metal copper, viewed by some analysts as a barometer of world economic health due to its wide variety of uses, finished the week up 4.1.
January Summary: It was the worst start to the year in decades for multiple major U.S. indexes. For the month, the Nasdaq Composite declined -9.0% in January, while the Dow retreated -3.3%. Large caps gave up -5.3%, while mid-caps pulled back -7.3%. Small caps fared the worst, plunging -9.7%. January was a difficult month for international benchmarks as well. Canada finished down -0.6%, while the United Kingdom rose 1.1%. France and Germany declined ‑2.2% and -2.6%, respectively, while China finished down -7.6%. Japan lost -6.2%. Developed markets finished the month down -3.6%, while emerging markets were flat. Oil surged 17.2% in January, while precious metals finished the month to the downside. Gold ended the month down -1.7% and Silver declined -4.1%. Copper declined ‑3.1% the first month of the year.
U.S. Economic News: The number of Americans filing first-time unemployment benefits fell for the second week as the ‘Omicron’ wave receded and more people were able to return to work. The Labor Department reported initial jobless claims declined by 23,000 to 238,000. Economists had forecast initial jobless claims would total 245,000. The economy had been hit with the fast-spreading Omicron strain of the coronavirus. New claims fell the most in Ohio, Kentucky, and Illinois. The only state to post a sizeable increase was Pennsylvania. Meanwhile, continuing claims, which counts the number of people already receiving benefits slipped by 44,000 to 1.63 million. That number has returned to its pre-crisis levels and near historic lows.
U.S. businesses shed 301,000 jobs in January, according to payroll processor ADP. It was the biggest drop since the start of the pandemic. The result was a huge miss. Economists had forecast a gain of 200,000 jobs. The decline was the first in 13 months and the largest since April 2020, when the U.S. lost almost 20 million jobs during the early stages of the pandemic. Almost every major segment of the economy suffered in January. The biggest decline in employment took place at small companies that mainly provide services: hotels, restaurants, entertainment venues, and transportation services. Small businesses lost 144,000 jobs. Employment also fell by 98,000 at large companies and 59,000 at midsized businesses during the Omicron surge.
Despite ADP’s data showing a huge loss of jobs, the government reported by its measure the U.S. actually gained 467,000 new jobs in January. Not only that, the Bureau of Labor Statistics revised its figures for preceding months upward stating the U.S. added 510,000 new jobs instead of the initially reported 199,000 in December. The report blew away economists’ expectations of 150,000 new jobs. Contrary to the ADP report, the fastest hiring gains last month took place at service-oriented companies such as hotels, restaurants and other businesses that were hit hardest by the coronavirus pandemic. Employment rose by 151,000 in the hospitality business, followed by 86,000 among white-collar businesses, 61,000 at retailers, and 54,000 in transportation and warehousing. However, not all analysts were impressed. Southbay Research noted that the bulk of the gain was due to a “seasonal adjustment”. And as they point out, “there has never been a January seasonal adjustment of this magnitude.” Using a normalized seasonal adjustment for January, the payrolls number is some 309,000 lower—or ends up being 166,000, right on top of expectations.
In the Labor Department’s latest Job Openings and Labor Turnover Survey (JOLTS), job openings rose by 150,000 to 10.9 million last month. Economists had forecast just 10.5 million vacancies. Meanwhile, the number of Americans quitting their jobs fell by 161,000 to 4.3 million in December from its record high in November. Prior to the pandemic, the average number of people quitting their jobs each month hovered around 3.2 million. The JOLTS report showed layoffs fell by 140,000, or 0.8%, to 1.2 million–a new record low. Stephen Stanley, chief economist at Amherst Pierpont, stated layoffs were running almost 50% higher in 2018 and 2019. Federal Reserve Chairman Jerome Powell stated, “This is, by so many measures, a historically tight labor market.”
A key measure of the vast services side of the U.S. economy slid in January to an 11-month low. The Institute for Supply Management (ISM) reported its index of service companies, which make up more than two-thirds of overall economic activity, declined 2.4 points to 59.9. Analysts blamed the Omicron outbreak for the decline. In the details, the index for new orders dropped 8.2 points to 61.5 while the production gauge slid 7 points to 67.6. The employment barometer also softened to 54.9 from 56.5. An executive at a wholesaler stated in the survey, “Labor shortages are causing issues. We could do much more business if we had more people and access to more products.” Anthony Nieves, chairman of the ISM services survey stated, businesses “continue to struggle with inflation, supply chain disruptions, capacity constraints, logistical challenges and shortages of labor and materials.”
Factory activity grew at its slowest pace in 14 months in January as the spread of the ‘Omicron’ variant slowed the U.S. economy, according to the latest data from the Institute for Supply Management (ISM) index of manufacturing activity. ISM reported manufacturing activity slipped 1.2 points to 57.6. Economists had expected the index to decline to 57.7. While readings above 50 still signify growth, the index has fallen three consecutive months. In the details, prices for raw materials and other supplies rose again complicating the decision by manufacturers on how much to stockpile. Orders and production remained quite robust, reflecting solid consumer demand. Senior economist Will Compernolle of FHN Financial summarized the report stating, “Given the rapid spread of Omicron last month and the number of people missing work from sickness, the results here aren’t as bad as they could be.”
International Economic News: Canada’s economy climbed above its pre-pandemic levels for the first time in November, official data showed. Statistics Canada reported the economy grew 0.6% in November, beating expectations for a gain of 0.3%. The agency said annualized GDP in the fourth quarter was likely up 6.3%, exceeding the Bank of Canada’s forecast of 5.8%. Doug Porter, chief economist at CMO Capital Markets noted the solid economic report reinforces the likelihood of an interest rate hike. Porter wrote, “While not far from the Bank of Canada’s latest estimate, it is a bit higher yet, and is simply another turn of the screw, all but ensuring a rate hike at their next meeting on March 2.” The central bank held its key interest rate unchanged last week, but said hikes were coming as Canada’s economy no longer needed extraordinary support to deal with the effects of the COVID-19 pandemic.
Across the Atlantic, the Bank of England raised its key interest rate a second quarter point to 0.5% – the first time it has implemented consecutive rate hikes since 2004. Of the nine members of the rate-setting monetary policy committee, five voted for an increase of 0.25%, while the other four wanted a steeper 0.5% hike, reflecting growing concerns about rising prices. The committee also warned it expected inflation to peak in April around 7.25%, about 2% higher than previously expected. “In the recent unprecedented circumstances, the economy has been subject to very large and repeated shocks,” the panel said. “Should recent movements prove persistent, the sharp rises in price of global energy and tradable goods of which the United Kingdom is a net importer will necessarily weigh on U.K. real aggregate income and spending.”
On Europe’s mainland, two months before French President Emmanuel Macron faces a tough reelection contest, inflation in France hit a 13-year peak. The country’s official statistics agency INSEE, announced France’s monthly consumer price index for January rose 2.9%–its highest reading since September 2008, and its annual inflation was 3.3%. The annual reading was down a fraction from the previous month’s 3.4% but well above the 3% that had been forecast by economists.
The head of the European Central Bank (ECB) said record inflation could linger for “longer than expected” and appeared to be considering the possibility of an interest rate increase later this year. Twice asked by reporters this week ECB President Christine Lagarde declined to repeat previous comments that a rate hike was “very unlikely” this year. She said officials would pay careful attention to the numbers and revisit their inflation stance next month. At the same time, she said the bank would stick with its schedule for withdrawing economic stimulus used to cushion the economic impact of the COVID-19 pandemic. Lagarde spoke after the bank left interest rates and stimulus programs unchanged even as the other central banks move to counter inflation with rate hikes.
The size of China’s economy surpassed the whole of the European Union for the first time this week. Figures released by the European Statistical Office (Eurostat) said the gross domestic product (GDP) of the EU grew by 5.2% for 2021 to just over $17 trillion. On the other hand, China’s GDP for 2021 expanded by 8.1% according to China’s National Bureau of Statistics. The full-year GDP for China increased by $3 trillion in 2021 to $17.7 trillion, leaping ahead of the European Union. The world’s second-largest economy benefited significantly during the Covid-19 crisis from its status as the world’s manufacturer. Analysts noted most of the economic gains for China were driven by strong industrial output and exports. China’s GDP growth rate easily surpassed the government’s target of above six percent growth, and the country is now expected to account for more than 18% of global GDP.
Japan’s top currency diplomat Masato Kanda said a weak yen has both merits and demerits for the economy due to the country’s changing export patterns and increasing reliance on imports. The comments underscore how a weak yen has become a tricky political issue for Japan’s finance ministry, which has been historically known for preventing a strong currency from hurting the country’s export sector. On recent yen moves against the dollar, Kanda said the currency pair now appeared to be “lacking a clear sense of direction”, having risen steadily last year. Kanda, the country’s vice finance minister for international affairs, said the boost a weak yen gives to Japan’s export volumes is now smaller than it used to be. Now manufacturers target shipments of high-end, state-of-the-art products overseas rather than cheaper mass-produced goods, as China has replaced Japan as the world’s manufacturer of those low-end products.
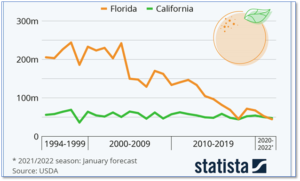
Finally: Along with gasoline and rent we get to add orange juice to the ever-expanding list of prices expected to skyrocket throughout the year. The January forecast for the U.S. citrus harvest is looking especially bleak for Florida orange growers. For the 2021/2022 season, the “Sunshine state” is expected to harvest 45 million 90 pound boxes in the state. If true, California’s crop (expected to be 47 million boxes) would exceed Florida’s for the first time ever. One of the results of the meager harvest would likely be rising orange juice prices. Analysts attribute the lower production to a worsening outbreak of citrus greening bacteria transmitted by a bug called the Asian citrus psyllid. (Data from USDA, chart from statista.com)
(Sources: All index- and returns-data from Yahoo Finance; news from Reuters, Barron’s, Wall St. Journal, Bloomberg.com, ft.com, guggenheimpartners.com, zerohedge.com, ritholtz.com, markit.com, financialpost.com, Eurostat, Statistics Canada, Yahoo! Finance, stocksandnews.com, marketwatch.com, wantchinatimes.com, BBC, 361capital.com, pensionpartners.com, cnbc.com, FactSet.) Securities offered through Registered Representatives of Cambridge Investment Research Inc., a broker-dealer, member FINRA/SIPC. Advisory Services offered through Cambridge Investment Research Advisors, a Registered Investment Adviser. Strategic Investment Partners and Cambridge are not affiliated. Indices mentioned are unmanaged and cannot be invested into directly. Past performance is no guarantee of future results.