
2-19-18 Market Update
2-19-18 Market Update
The very big picture:
In the “decades” timeframe, the current Secular Bull Market could turn out to be among the shorter Secular Bull markets on record. This is because of the long-term valuation of the market which, after only eight years, has reached the upper end of its normal range.
The long-term valuation of the market is commonly measured by the Cyclically Adjusted Price to Earnings ratio, or “CAPE”, which smooths out shorter-term earnings swings in order to get a longer-term assessment of market valuation. A CAPE level of 30 is considered to be the upper end of the normal range, and the level at which further PE-ratio expansion comes to a halt (meaning that increases in market prices only occur in a general response to earnings increases, instead of rising “just because”).
Of course, a “mania” could come along and drive prices higher – much higher, even – and for some years to come. Manias occur when valuation no longer seems to matter, and caution is thrown completely to the wind as buyers rush in to buy first and ask questions later. Two manias in the last century – the 1920’s “Roaring Twenties” and the 1990’s “Tech Bubble” – show that the sky is the limit when common sense is overcome by a blind desire to buy. But, of course, the piper must be paid and the following decade or two are spent in Secular Bear Markets, giving most or all of the mania gains back.
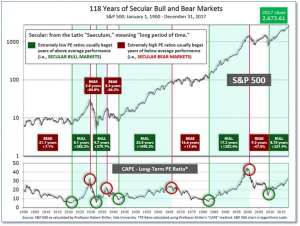
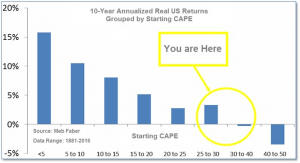
See Fig. 1 for the 100-year view of Secular Bulls and Bears. The CAPE is now at 33.06, up from the prior week’s 31.69, and still exceeds the level reached at the pre-crash high in October 2007. This value is at the lower end of the “mania” range. Since 1881, the average annual return for all ten year periods that began with a CAPE around this level has been in the 0% – 3%/yr. range. (see Fig. 2).
In the big picture:
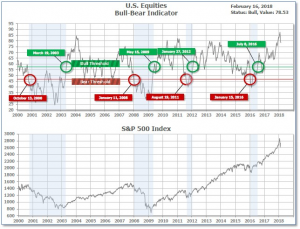
The “big picture” is the months-to-years timeframe – the timeframe in which Cyclical Bulls and Bears operate. The U.S. Bull-Bear Indicator (see Fig. 3) is in Cyclical Bull territory at 78.53, down from the prior week’s 79.79.
In the intermediate and Shorter-term picture:
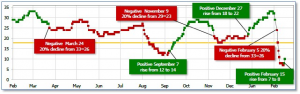
The Shorter-term (weeks to months) Indicator (see Fig. 4) turned positive on February 15th. The indicator ended the week at 10, up from the prior week’s 8. Separately, the Intermediate-term Quarterly Trend Indicator – based on domestic and international stock trend status at the start of each quarter – was positive entering January, indicating positive prospects for equities in the first quarter of 2018.
Timeframe summary:
In the Secular (years to decades) timeframe (Figs. 1 & 2), the long-term valuation of the market is simply too high to sustain rip-roaring multi-year returns – but the market has entered the low end of the “mania” range, and all bets are off in a mania. The only thing certain in a mania is that it will end badly…someday. The Bull-Bear Indicator (months to years) is positive (Fig. 3), indicating a potential uptrend in the longer timeframe. In the intermediate timeframe, the Quarterly Trend Indicator (months to quarters) is positive for Q1, and the shorter (weeks to months) timeframe (Fig. 4) is positive. Therefore, with internal unanimity expressed by all three indicators being positive, the U.S. equity markets are rated as Positive.
In the markets:
U.S. Markets: Stocks rebounded strongly from the carnage of the previous week and recorded their best weekly gains since early 2013. The technology-heavy NASDAQ Composite performed the best, while the energy sector lagged despite the sharp rally in oil prices. After hitting the “correction” level, defined as a drop of 10% or more from recent highs, the indexes finished the week down just 4-5% from their January highs. The Dow Jones Industrial Average retraced most of last week’s loss, rising over 1000 points, or 4.25%, to close at 25,219. The NASDAQ surged 5.3% and regained the 7,000 level ending the week at 7,239. By market cap, large caps slightly lagged their smaller cap brethren. The large-cap S&P 500 index gained 4.3%, while the S&P 400 mid-cap and Russell 2000 small-cap indexes rose 4.4% and 4.5%, respectively.
International Markets: Canada’s TSX also retraced most of last week’s losses by rising 2.8%. In Europe, the United Kingdom’s FTSE gained 2.9%, while on Europe’s mainland France’s CAC 40 gained 4%, Germany’s DAX added 2.9%, and Italy’s Milan FTSE rose 2.9%. In Asia, China’s Shanghai Composite only managed to retrace 2.2% of last week’s 9.6% plunge. Japan’s Nikkei rose 1.6% while with Hong Kong’s Hang Seng jumped 5.5%. As grouped by Morgan Stanley Capital International, emerging markets added a robust 6.7%, while developed markets gained 4.1%.
Commodities: Precious metals joined in the equity rebound with Gold rising 3.1% to $1,356.20 an ounce and Silver adding 3.6% to $16.71 an ounce. Energy rebounded almost 4% with West Texas Intermediate crude oil rising $2.35, ending the week at $61.55 per barrel. Copper, viewed by some analysts as an indicator of global economic health due to its variety of industrial uses, rose a very strong 7%.
U.S. Economic News: Applications for new unemployment benefits increased slightly last week, but layoffs in the U.S. remained near a 45-year low. According to the Labor Department, initial jobless claims increased by 7,000 to 230,000, which matched economists’ forecasts. The less-volatile four-week average of claims rose by 3,500 to 228,500. Jobless claims have now been below the key 300,000 threshold that signals a healthy labor market for 154 straight weeks, nearing the all-time record of 160 consecutive weeks. Continuing claims, which counts the number of people already collecting unemployment benefits rose by 15,000 to 1.94 million. Over 2.4 million people were receiving benefits at the same time last year.
The number of new homes under construction continues to close in on the highs set during the housing bubble of 2007 as housing starts surged 10% in January to an annual rate of 1.33 million. The reading was its second-highest since the Great Recession and blew away analysts’ forecasts of 1.24 million. In addition, the number of permits to build new homes jumped to a 10 ½ year high, up 7.4% to an annual rate of 1.4 million. Construction increased in the North, South, and West and, importantly, two-thirds of new construction was single-family homes. Compared to the same time last year, housing starts are up 7%. Analysts report that the biggest issue weighing on housing continues to be demand outstripping the available supply, pushing prices outside the reach of many would-be buyers.
The Commerce Department reported that sales among the nation’s retailers unexpectedly fell 0.3% in January, its biggest drop in a year, as households cut back on purchases of motor vehicles and building materials. December’s reading was revised to unchanged instead of rising 0.4% as previously reported. Economists had expected a gain of 0.2%. On an annual basis, retail sales were nevertheless up 3.6% from a year ago. Stuart Hoffman, senior economic adviser at PNC Financial Services, was optimistic following the report noting, “This is a temporary pause in consumer spending following a strong holiday sales season.”
Sentiment among the nation’s small business owners continues to soar due to the change in tone towards businesses in Washington. The National Federation of Independent Businesses (NFIB) small business optimism index climbed two points last month to a reading of 106.9. The improvement came following a dip in December and exceeded analysts’ forecasts by 1.4 points. Perhaps a harbinger for the nation’s future economy was the all-time high number of respondents reporting “now is a good time to expand.” The NFIB said in its release, “The record level of enthusiasm for expansion follows a year of record-breaking optimism among small businesses.” Of the index subcomponents, six of the ten improved, while two declined, and two remained unchanged. As has been the case, business owners continue to report that finding qualified workers continues to be their biggest problem—worse even than taxes and regulation. The index remains just below November’s reading, the second-highest in the survey’s 45-year history.
Consumer sentiment climbed to its second-highest level in 14 years, according to the University of Michigan. The University said its index rose to a reading of 99.9 in February, up 4.2 points from January, and soundly topped forecasts for a reading of 95.3. In the details, there were big gains in both the current economic conditions and the expectations sub-indexes. The tax cuts enacted by President Trump are now starting to impact workers’ paychecks, along with the strong jobs market, and solid economic growth has consumers confident about the future. Richard Curtin, chief economist of the survey stated in its release, “Purchase plans have been transformed from the attraction of deeply discounted prices and low interest rates that outweighed economic uncertainty, to being based on a sense of greater income and job security – the fewest consumers in decades mentioned the favorable impact of low prices and interest rates.”
Two separate gauges of manufacturing sentiment continued to show solid growth this month. The Philadelphia Fed’s manufacturing index rose 3.6 points to 25.8 this month, beating forecasts of a retreat to 21. In the details, the new orders gauge surged 14.4 points to 24.5, which bodes well for future economic activity. However on a down note, the shipments gauge declined to 15.5 from 30.3. The New York Fed’s Empire State index slowed 4.6 points to 13.1. In New York, both the new orders and shipments gauges were little changed. Both indexes remained well above zero which indicates improving conditions. John Silvia, chief economist at Wells Fargo stated, “The factory sector recovery that took hold in 2017 remains firmly in place. The collective 2015-2016 headwinds of weak demand at home and abroad, falling commodity prices and a strong U.S. dollar have been flipped on their heads, with no immediate end in sight.”
A key measure of inflation trends jumped more than forecast last month, sparking renewed fears of inflation. The Labor Department reported the Consumer Price Index (CPI) rose 0.5% last month, whereas economists had expected only a 0.3% increase. Excluding the volatile food and energy categories, the index was still up 0.3% versus estimates of 0.2%. The report showed that price pressures were “broad based” with gasoline, shelter, clothing, medical care, and food all rising. On an annualized basis, headline CPI rose 2.1%, up 0.2% from expectations, while core CPI increased 1.8% versus expectations of 1.7%. Peter Boockvar, chief investment officer at Bleakley Advisory Group stated, “The worry of the markets is not that inflation is becoming a big problem…it is that the Fed is now forced to play catch up at the same time they are shrinking their balance sheet.”
At the producer level, price inflation has also taken hold as wholesale prices jumped 0.4% last month. While oil prices were a contributor to the increase, the more stable core PPI, which strips out food, energy, and trade margins, also rose 0.4% suggesting that price pressures are more widespread. Annualized, wholesale inflation rose a tick to 2.7%, but it remained below its six-year high of 3.1% hit recently.
Adding to the consumer and producer inflation concerns, the import price index also jumped, up by 1% in January. The Bureau of Labor Statistics reported that increases in the price of oil, German automobiles, French food, and Italian wines all contributed. Ex-fuel, import prices were still up 0.4%, the biggest increase in six years. The falling dollar has made overseas goods more expensive, while the strong American economy has encouraged people to spend. The new inflation data has some analysts now thinking the Federal Reserve will raise interest rates four times this year instead of the three previously anticipated.
International Economic News: Canada’s Finance Minister Bill Morneau stated Canada won’t be “impulsive” responding to U.S. tax cuts. After meeting with private sector economists, Morneau stated that the Liberal government will not “act in an impulsive way” in response to U.S. corporate tax cuts that economists said may pose a threat to Canada’s competitiveness. Morneau said the government is conducting a careful analysis in connection with U.S. President Trump’s sweeping tax reforms. Morneau remained tight-lipped about the release of Canada’s budget on February 27th, but said that his recent discussions focused on negotiations of the North American Free Trade Agreement and the impact of U.S. tax changes on the Canadian economy.
Across the Atlantic, Britain’s government is ready to push for the kind of Brexit plan endorsed by the United Kingdom’s financial center of London. The City of London has stated it wants a mutual recognition system to regulate financial services after Brexit in the hopes of maintaining the City of London’s access to the European Union. An unnamed official stated, “It is obviously in everyone’s interest to not just totally turn on its head the pan-European banking system…Everyone has a lot to lose from this if we can’t get a deal.” Bank of England Governor Mark Carney has previously stated Britain and the EU should adopt a system of mutual recognition in the financial services sector. With a little more than a year before Brexit takes place, many banks have begun activating contingency plans to move some operations out of the country.
French President Emmanuel Macron’s policies continue to be praised as the French economy continues to power ahead. French unemployment fell to its lowest level since 2009 – the most obvious sign of economic improvement in the Eurozone’s second-largest economy. Unemployment dropped to just 8.9% in the final quarter of last year, down from 9.6% in the third quarter. The decrease was the largest drop for any single quarter since at least 1996. Christian Schulz, European economist at Citi stated, “France seems to have turned a corner. This is a real sign that the boost in confidence we have seen in France, which is reverberating across the Eurozone, is translating to stronger job creation in the country.” French statistics agency Insee reported France’s economy grew at its fastest rate in 10 years in 2017, expanding at 1.9%.
The German economy grew 2.2% last year, with another quarter of solid growth in the final months of 2017. As Europe’s main economic powerhouse, Germany is benefitting from economic strength throughout the bloc and with major trading partners around the world. According to Germany’s statistics agency Destatis, the economy grew 0.6% in the fourth quarter, matching economists’ forecasts. Destatis described the growth as “steady and strong”. Growth in the final quarter was driven primarily by foreign demand and “exports increased substantially.” In addition, Destatis noted that government spending rose and household consumption remained essentially flat. Analysts broadly agree that the strong economic performance is expected to continue in 2018.
The greatest risk to China’s economy, as seen by many analysts, is rising corporate and household debt. Since 2009, China has been one of the leading world generators of debt, contributing to the growing concern over global inflation. Thus far, China has amassed debt equivalent to $4.3 trillion USD, or about 41% of China’s gross domestic product. The debt has been managed…by issuing more debt. The latest data from the People’s Bank of China reveals that China created a record 2,900 billion yuan ($458 billion) in new loans in January. Beijing rolled out more policies last month to restrict riskier financial operations supported by loose lending, but the International Monetary Fund still warns that China’s inability to control expanding debt increases the risk of a financial crisis.
The Japanese economy has now posted its longest growth streak since the boom decade of the 1980’s as fourth quarter growth rose 0.5%, driven by an increase in consumer spending. This long run of growth is encouraging for the Bank of Japan and hints that the Japanese economy may finally build up enough momentum to reach the BOJ’s 2% inflation target. Hiroaki Mutu, economist at Tokai Tokyo Research Center noted, “Economic fundamentals look good and growth this year is likely to be above the economy’s potential.” World financial markets appear to be on edge because central banks in the United States and Europe are poised to raise interest rates to stay ahead of inflation, but the Bank of Japan is still expected to intentionally lag well behind its peers.
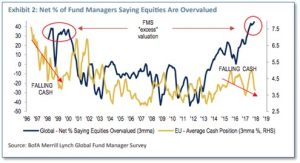
Finally: As of late, analysts have repeatedly sounded the alarm over the extreme valuation in the U.S. equity markets by looking at just about every traditional market valuation metric. Interestingly enough, a recent survey of institutional investors by Bank of America Merrill Lynch found that while most institutional investors agreed the market had an “excessive valuation”, those same managers also were heavily over-weighted in equities. Analysts have coined the term “fully invested bear”, to describe this
new behavior. The explanation for this paradoxical stance could perhaps be best described by the relatively new acronym of “FOMO” – “Fear Of Missing Out”.
(sources: all index return data from Yahoo Finance; Reuters, Barron’s, Wall St Journal, Bloomberg.com, ft.com, guggenheimpartners.com, zerohedge.com, ritholtz.com, markit.com, financialpost.com, Eurostat, Statistics Canada, Yahoo! Finance, stocksandnews.com, marketwatch.com, wantchinatimes.com, BBC, 361capital.com, pensionpartners.com, cnbc.com, FactSet)
Indices mentioned are unmanaged and cannot be invested into directly. Past performance is no guarantee of future results. All Investing involves risk. Depending on the types of investments, there may be varying degrees of risk. Investors should be prepared to bear loss, including total loss of principal.