
12-9-19 Weekly Market Update
The very Big Picture:
The long-term valuation of the market is commonly measured by the Cyclically Adjusted Price to Earnings ratio, or “CAPE”, which smooths out shorter-term earnings swings in order to get a longer-term assessment of market valuation. A CAPE level of 30 is considered to be the upper end of the normal range, and the level at which further PE-ratio expansion comes to a halt (meaning that increases in market prices only occur in a general response to earnings increases, instead of rising “just because”). The market is currently at that level.
Of course, a “mania” could come along and drive prices higher – much higher, even – and for some years to come. Manias occur when valuation no longer seems to matter, and caution is thrown completely to the wind as buyers rush in to buy first and ask questions later. Two manias in the last century – the 1920’s “Roaring Twenties” and the 1990’s “Tech Bubble” – show that the sky is the limit when common sense is overcome by a blind desire to buy. But, of course, the piper must be paid and the following decade or two are spent in Secular Bear Markets, giving most or all of the mania gains back.
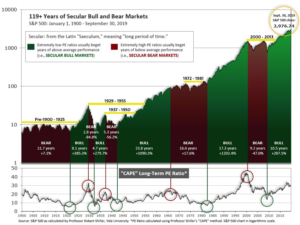
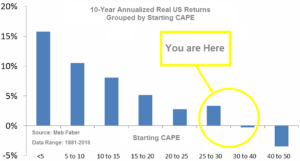
See Fig. 1 for the 100-year view of Secular Bulls and Bears. The CAPE is now at 30.14, down from the prior week’s 30.54, above the level reached at the pre-crash high in October, 2007. Since 1881, the average annual return for all ten year periods that began with a CAPE around this level have been in the 0% – 3%/yr. range. (see Fig. 2).
In the Big Picture:
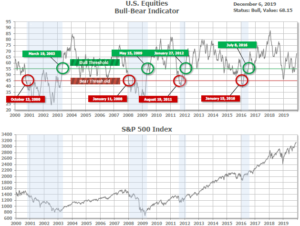
The “big picture” is the months-to-years timeframe – the timeframe in which Cyclical Bulls and Bears operate. The U.S. Bull-Bear Indicator (see Fig. 3) is in Cyclical Bull territory at 68.15, up from the prior week’s 66.36.
In the Intermediate and Shorter-term Picture:
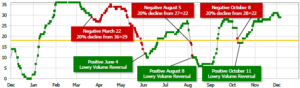
The Shorter-term (weeks to months) Indicator (see Fig. 4) is positive. The indicator ended the week at 29, down from the prior week’s 31. Separately, the Intermediate-term Quarterly Trend Indicator – based on domestic and international stock trend status at the start of each quarter – was positive entering October, indicating positive prospects for equities in the fourth quarter of 2019.
Timeframe Summary:
In the Secular (years to decades) timeframe (Figs. 1 & 2), the long-term valuation of the market is historically too high to sustain rip-roaring multi-year returns. The Bull-Bear Indicator (months to years) remains positive (Fig. 3), indicating a potential uptrend in the longer timeframe. In the intermediate timeframe, the Quarterly Trend Indicator (months to quarters) is positive for Q4, and the shorter (weeks to months) timeframe (Fig. 4) is positive. Therefore, with three indicators positive and none negative, the U.S. equity markets are rated as Positive.
In the Markets:
U.S. Markets: The major U.S. benchmarks ended the week mixed after a strong jobs report sparked a rally at the end of the week. The smaller-cap benchmarks outperformed their larger-cap brethren for a second consecutive week. The S&P 400 mid cap index led the way rising 0.6% followed by the small cap Russell 2000 and S&P 500, which added 0.6% and 0.2%, respectively. The technology-heavy NASDAQ Composite and Dow Jones Industrial Average each finished the week down -0.1%.
International Markets: Canada’s TSX retreated -0.3%, while the United Kingdom’s FTSE fell a steeper -1.5%. On Europe’s mainland, France’s CAC 40 gave up -0.6%, Germany’s DAX fell -0.5% and Italy’s Milan FTSE fell -0.3%. Asian markets fared better, with China’s Shanghai Composite rallying 1.4% and Japan’s Nikkei rising 0.3%. As grouped by Morgan Stanley Capital International developed markets added 0.8%, while emerging markets rose 1.3%.
Commodities: Precious metals retreated this week, with gold giving up -0.5% to close at $1465.10 per ounce and silver fell -3% to $16.60. Oil retraced all of last week’s decline rallying 7.3% to $59.20 per barrel of West Texas Intermediate crude. The industrial metal copper, viewed as a barometer of global economic health due to its wide variety of uses, rose for a third straight week gaining 2.4%.
U.S. Economic News: Hiring surged in November as the economy added a robust 266,000 new jobs last month and the unemployment rate returned to the 50-year low of 3.5%, the Bureau of Labor Statistics (BLS) reported. The increase in employment was the biggest since the beginning of the year, boosted by the return of nearly 50,000 UAW workers that had been on strike. Hiring was strong across the board with health care, hospitality, and professional occupations leading the way. Chris Low, chief economist at FHN Financial stated, “This was a strong report, with a solid rise in payrolls, another drop in the unemployment rate, and decent growth in hourly earnings.” The strong BLS numbers are expected to translate into a healthy holiday shopping season. Sal Guatieri, senior economist at BMO Capital Markets wrote, “All these new jobs will only put an extra spring in the step of holiday shoppers.” Economists really missed, with their average expectation of just 180,000 new jobs.
Manufacturing activity in the U.S. rose to a seven-month high last month, according to the U.S. Manufacturing Purchasing Managers Index (PMI) from IHS Markit. The PMI’s final reading for November was 52.6, driven by the strongest improvement since April, IHS Markit said. The reading was up 1.3 points from October. In the details, IHS Markit reported production and new orders rose at their fastest rates since January, with both domestic and foreign client demand strengthening. Despite the increase, though, the reading remained below the long-run series trend. Chris Williamson, IHS Markit chief business economist, said business sentiment “remains worryingly subdued,” with expectations about future growth down from earlier in the year. “Firms remain very concerned about the disruptive effects of tariffs and trade wars in particular, both in terms of rising prices and weakened demand,” Mr. Williamson said.
The news for the services side of the economy wasn’t as positive as that for the manufacturing side, according to research firm ISM. The Institute for Supply Management (ISM) reported its index of service-oriented companies such as hospitals, retailers and restaurants, fell to 53.9 last month from 54.7. While numbers over 50 still indicate expansion, the index has come down sharply from a 13-year high of 60.8 hit just a little over a year ago. In the report, the index for business production in the service sector slumped 5.4 points to 51.6, accounting for most of the decline in the overall survey. Yet new orders actually rose, as did employment and exports. The index for employment rose to 55.5 from 53.7 suggesting increased hiring for the holiday season, but companies still reported having a hard time finding qualified workers with unemployment at a 50-year low. A similar survey of the services side of the economy by IHS Markit rose 1 point to 51.6 last month.
International Economic News: While the U.S. economy enjoyed robust jobs growth last month, Canada was going the other way. The Canadian economy posted its biggest monthly job loss since the Great Financial Crisis. Statistics Canada reported the economy lost 71,200 jobs last month and the unemployment rate rose four-tenths of a percentage point to 5.9% – its highest reading since August of 2018. The report missed analysts’ expectations by a wide margin. Economists had expected a gain of 10,000 new jobs and the unemployment rate to remain at 5.5%. Brett House, deputy chief economist at Scotiabank, said the drop in jobs puts pressure on the Bank of Canada to cut interest rates next year. “It really undermines the notion from the Bank of Canada in the last few days that they’ve communicated that they chart their own course,” House said. The jobs report followed a decision by the Bank of Canada earlier this week to keep its key interest rate on hold at 1.75%, where it has been set for more than a year. Many of the Bank of Canada’s international peers have moved to cut rates and loosen monetary policy in response to weakness in the global economy.
In Europe, French wine could face 100% tariffs as U.S. President Trump confronts France over its so-called “digital taxes” on U.S. tech behemoths including Facebook and Google. The tariffs are in response to the new French technology tax that is said to “discriminate against U.S. companies” and is “unusually burdensome”, according to the Office of the United States Trade Representative (OTR). The OTR report recommended tariffs as high as 100% on certain French imports including cheese, wine, and handbags. France’s economy and finance minister, Bruno Le Maire, denounced the tariff threat as “unacceptable” and said that Europe would come ahead with a “strong response,” without elaborating on possible retaliatory measures.
Europe’s economic powerhouse Germany continues to face weakness in its manufacturing sector. Germany’s Federal Statistics Office reported that new manufacturing orders fell by 0.4% from September to October. Economists had expected an increase of 0.3%. Adding to the dismal report, most German industrial companies said their order books shrank further last month. Until now, consumer spending has more than offset the weakness in Germany’s manufacturing sector. However, in a separate report there is a worrying sign that consumers pulled back in October. Retail sales in the Eurozone fell 0.6%, a much steeper decline than the 0.2% fall in September. Rosie Colthorpe at Oxford Economics wrote, “The second monthly fall in a row shows that uncertainty regarding the economic outlook may be starting to weigh on consumers’ spending decisions.”
Asian securities markets advanced on the heels of a couple of economic reports that showed strength in China’s manufacturing sector. According to research firm Markit, manufacturing grew at its strongest pace in nearly three years. The private Caixin/Markit Purchasing Managers’ Index (PMI) ticked up 0.1 point to 51.8 in November. In addition, China’s “official” government PMI data showed an increase of 0.9 point to 50.2—an eight-month high, and back in expansion (>50) territory. The majority of analysts surveyed were unimpressed with the improvement, however. Analysts at research firm Nomura Securities wrote, “We do not think such a rise suggests a bottoming out of the economy.” Analysts from Macquarie, meanwhile, said the most recent data is a sign of “short-term stabilization.” But they added in a note that “the worst is yet to come.”
Japan is preparing an economic stimulus package worth over $120 billion, two government officials with direct knowledge of the plan stated this week. In addition, the package would rise to $230 billion when private-sector and other spending is included. The first stimulus package in three years centers on measures to spark consumer spending, and also contains spending on public works to bolster infrastructure. Prime Minister Shinzo Abe stated “We have crafted a powerful policy package aimed at … helping overcome economic downside risks,” in a meeting with senior government officials. Shunsuke Kobayashi, senior economist at Daiwa Institute of Research wrote in a note to clients that the economic package will help “ease the pain to some extent … and keep consumption from stalling.”
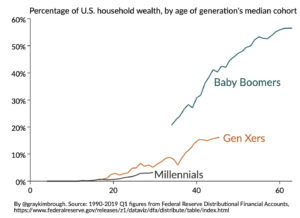
Finally: It seems that the “baby boomer” generation (those born between 1946 and 1964) has fared far better financially than the subsequent generations throughout every stage of life. When baby boomers hit a median age of 35 in 1990, they collectively owned 21% of the nation’s wealth. When Generation X (born between 1965 and 1980) hit that same milestone, they owned just 9% of the nation’s wealth. For Millennials (born between 1981 and 1996), it was even worse. Currently boomers boast more than half (57%) of the nation’s wealth, while Gen X owns just 16%, and millennials 3%. On a positive note, boomers are expected to pass on their estates to their heirs in an upcoming period being called “the great wealth transfer”. That event may see millennials collecting around $59 trillion in wealth and assets! (Chart from economist Gray Kimbrough via Marketwatch.com)
(Sources: all index return data from Yahoo Finance; Reuters, Barron’s, Wall St Journal, Bloomberg.com, ft.com, guggenheimpartners.com, zerohedge.com, ritholtz.com, markit.com, financialpost.com, Eurostat, Statistics Canada, Yahoo! Finance, stocksandnews.com, marketwatch.com, wantchinatimes.com, BBC, 361capital.com, pensionpartners.com, cnbc.com, FactSet) Securities offered through Registered Representatives of Cambridge Investment Research Inc., a broker-dealer, member FINRA/SIPC. Advisory Services offered through Cambridge Investment Research Advisors, a Registered Investment Adviser. Strategic Investment Partners and Cambridge are not affiliated.
Indices mentioned are unmanaged and cannot be invested into directly. Past performance is no guarantee of future results. All Investing involves risk. Depending on the types of investments, there may be varying degrees of risk. Investors should be prepared to bear loss, including total loss of principal.