12-16-19 Weekly Market Update
The very Big Picture:
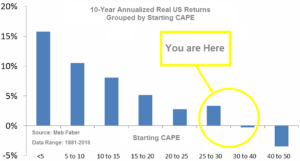
The long-term valuation of the market is commonly measured by the Cyclically Adjusted Price to Earnings ratio, or “CAPE”, which smooths out shorter-term earnings swings in order to get a longer-term assessment of market valuation. A CAPE level of 30 is considered to be the upper end of the normal range, and the level at which further PE-ratio expansion comes to a halt (meaning that increases in market prices only occur in a general response to earnings increases, instead of rising “just because”). The market is currently at that level.
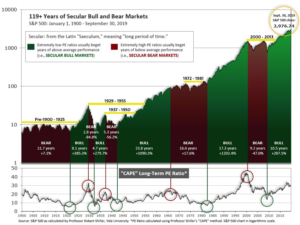
Of course, a “mania” could come along and drive prices higher – much higher, even – and for some years to come. Manias occur when valuation no longer seems to matter, and caution is thrown completely to the wind as buyers rush in to buy first and ask questions later. Two manias in the last century – the 1920’s “Roaring Twenties” and the 1990’s “Tech Bubble” – show that the sky is the limit when common sense is overcome by a blind desire to buy. But, of course, the piper must be paid and the following decade or two are spent in Secular Bear Markets, giving most or all of the mania gains back.

See Fig. 1 for the 100-year view of Secular Bulls and Bears. The CAPE is now at 30.38, up from the prior week’s 30.14, above the level reached at the pre-crash high in October, 2007. Since 1881, the average annual return for all ten year periods that began with a CAPE around this level have been in the 0% – 3%/yr. range. (see Fig. 2).

In the Big Picture:
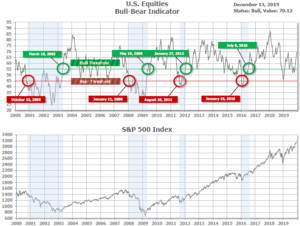
The “big picture” is the months-to-years timeframe – the timeframe in which Cyclical Bulls and Bears operate. The U.S. Bull-Bear Indicator (see Fig. 3) is in Cyclical Bull territory at 70.12, up from the prior week’s 68.15.

In the Intermediate and Shorter-term Picture:
The Shorter-term (weeks to months) Indicator (see Fig. 4) is positive. The indicator ended the week at 30, up from the prior week’s 29. Separately, the Intermediate-term Quarterly Trend Indicator – based on domestic and international stock trend status at the start of each quarter – was positive entering October, indicating positive prospects for equities in the fourth quarter of 2019.

Timeframe summary:
In the Secular (years to decades) timeframe (Figs. 1 & 2), the long-term valuation of the market is historically too high to sustain rip-roaring multi-year returns. The Bull-Bear Indicator (months to years) remains positive (Fig. 3), indicating a potential uptrend in the longer timeframe. In the intermediate timeframe, the Quarterly Trend Indicator (months to quarters) is positive for Q4, and the shorter (weeks to months) timeframe (Fig. 4) is positive. Therefore, with three indicators positive and none negative, the U.S. equity markets are rated as Positive.
In the Markets:
U.S. Markets: The major U.S. indexes ended higher after another week in which trade headlines held sway over sentiment. News of a preliminary U.S.-China trade deal lifted the “Big Three”, the Dow Jones Industrial Average, the S&P 500 large cap index, and the technology-heavy NASDAQ Composite to new record highs. The Dow Jones Industrial Average added 120 points to close at 28,135 – a gain of 0.4%. The NASDAQ added 0.9% and the S&P 500 rose 0.7%. The small cap Russell 2000 and mid cap S&P 400 underperformed the larger cap indexes, rising 0.3% and 0.1%, respectively.
International Markets: Major international markets were a sea of green as trade tensions appeared to de‑escalate. Canada’s TSX rose a slight 0.04%, while the United Kingdom’s FTSE rallied 1.6% aided by Boris Johnson’s electoral victory. On Europe’s mainland, France’s CAC 40 added 0.8%, Germany’ DAX rose 0.9%, and Italy’s Milan FTSE gained 0.6%. Asian markets were especially strong. China’s Shanghai Composite jumped 1.9% and Japan’s Nikkei surged 2.9%. As grouped by Morgan Stanley Capital International, emerging markets rose 3.1% and developed markets added 1.4%.
Commodities: Precious metals rebounded last week with Gold rising 1.1% to finish the week at $1481.20 an ounce and Silver adding 2.5% to close at $17.01. Energy rose for a second consecutive week. West Texas Intermediate crude oil gained 1.5% closing at $60.07 per barrel. Copper, viewed by some analysts as a barometer of global economic health due to its wide variety of industrial uses, rose for a fourth consecutive week by tacking on 2.1%.
U.S. Economic News: The number of Americans seeking first time unemployment benefits soared to a more than two-year high last week but analysts downplayed it, stating the spike was most likely tied to a later than usual Thanksgiving holiday season instead of actual rising layoffs. Initial jobless claims jumped by 49,000 to a seasonally-adjusted 252,000 in the first week of December. The reading was its highest since September of 2017. Economists had estimated new claims would total just 220,000. Jobless claims often gyrate during the long holiday season that starts after Thanksgiving. Laid-off workers wait longer to file claims, unemployment offices are closed more often and companies add and drop temporary workers. The more stable monthly average of new claims, by contrast, rose a much smaller 6,250 to 224,000. That reading is more likely to reflect the underlying level of jobless claims. Continuing claims, which counts the number of people already collecting unemployment benefits, fell by 31,000 to 1.67 million. That number is reported with a one-week delay.
Americans paid more for energy, healthcare and rent last month, lifting the rate of inflation to its highest level in a year. The Bureau of Labor Statistics reported its Consumer Price Index rose 0.3% last month. Economists had estimated just a 0.2% advance. The recent spike lifted the increase in the cost of living over the past year to 2.1%. That’s its highest level since November 2018. Still, economists note, inflation remains low by historical standards. Core CPI, which strips out the volatile food and energy categories, increased by 0.2% last month. The annual increase in the core rate remained unchanged at 2.3%. The Federal Reserve’s preferred inflation gauge, the Personal Consumption Expenditures (PCE) Index remains significantly lower than the CPI measure. The PCE index is up just 1.3% in the 12 months ended in October. Economists note that even if prices rise faster than expected, the Federal Reserve is comfortable with an inflation rate above 2% after years of undershooting its target. Richard Moody, chief economist at Regions Financial stated that “the Fed has signaled it will be comfortable letting inflation run ahead of their target, which means it will be even longer before inflation again becomes a material concern.”
At the wholesale level, the government reported the cost of goods and services remained flat in November indicating that inflation is likely to remain tame in at least the near future. Economists had predicted a 0.2% increase. Wholesale inflation has risen just 1.1% over the past year, marking its lowest rate since 2016. The yearly rate had touched a seven-year high of 3.4% just over a year and a half ago. In the details, the cost of services declined 0.3%, offsetting a 0.3% increase in the price of goods. Core PPI was also flat last month. That measure of inflation’s annual rate slipped to 1.3% – its smallest year-over-year increase in three years. Michael Pearce, senior U.S. economist at Capital Economics wrote, “Overall, the November PPI figures underline that price pressures in the inflation pipeline are still easing. Against that backdrop, the Fed is going to remain on hold a lot longer than just through the end of 2020.”
Sales at U.S. retailers rose only slightly in November leading to concerns among analysts of a possibly poor holiday shopping season. The Commerce Department reported retail sales edged up just 0.2% in November. Economists had expected a 0.5% increase. One possible reason for the shortfall could be that the late Thanksgiving this year pushed the first big weekend of holiday spending into December. In the details of the report, internet-based retailers fared the best, as well as electronics and appliances retailers. However, the rest of the retail industry lagged behind. Still, analysts note that a strong 2019 holiday season may be in store. They note the labor market is robust, unemployment is low, stocks are at record highs, and consumer confidence has rebounded after a late-summer lull.
The Fed statement released during the week gave a more upbeat view of the economy than has been recently the case. Fed Chair Jerome Powell stated he doesn’t expect to raise interest rates again for at least another year. At the Fed’s final policy meeting of the year, the board voted unanimously to leave its benchmark rate in the range of 1.5-1.75%. It was the first vote without a dissent in the last five meetings. The central bank also signaled its intention to leave interest rates unchanged through the end of 2020. Economist Andrew Hollenhorst of Citibank said in a note to clients, “Powell was very explicit in guiding that only a ‘persistent, significant’ rise in inflation would lead him to support hikes.” The Fed had cut U.S. interest rates in three successive meetings starting in July to support the economy in the midst of a trade war with China. Senior Fed officials believe the series of rate cuts has helped stabilize the economy and lower the odds of recession.
International Economic News: The Bank of Canada kept its key interest rate on hold at 1.75% this week, where it has been set for more than a year. Bank of Canada governor Stephen Poloz said the global economy appears set for continued slow growth and that low global interest rates are likely to persist. The Canadian central bank has stood out from many of its global peers that have moved this year to loosen monetary policy and cut interest rates to offset a slowing global economic growth. In keeping its overnight rate target on hold, the bank said the potential of a global recession was waning, but ongoing trade conflicts and related uncertainty still weighed on the global economy and remained the biggest source of risk to its outlook.
Across the Atlantic, the United Kingdom’s Prime Minister Boris Johnson won a resounding victory that will allow him to end three years of political paralysis over Brexit and take the nation out of the European Union more quickly. In the short term, the United Kingdom’s election result will likely boost the economy and financial markets as it will ease some of the uncertainty that has weighed on business confidence. The prime minister has signaled that he wants looser economic ties with the EU in order to have the freedom to pursue commercial deals with faster-growing economies such as the United States and countries in Asia. The British pound and UK stocks jumped higher on the outcome of the vote despite many doomsayers predicting the opposite.
On Europe’s mainland, French unions pledged more protests following the release of the government’s details of its pension overhaul. Prime Minister Édouard Philippe delivered an address that many hoped might end the impasse by detailing the changes and assuaging union worries about the pension overhaul. Instead, his announcement threw more fuel on the fire. The most contentious change appears to be the introduction of incentives for workers to retire two years after the legal retirement age of 62 and penalties for those who don’t. Laurent Berger, President of France’s largest union CFDT stated, “A red line has been crossed.”
Economists are saying that 2020 will not be an easy year for Europe’s largest economy. Uwe Burkert, chief economist of the Landesbank Baden-Wuttemberg said bluntly, “It’s going to be a difficult year. Germany will not be able to escape that.” International trade conflicts, a slowdown in world trade and Britain’s exit from the European Union are hitting Germany’s export-oriented economy particularly hard. Furthermore, many German companies are still desperately searching for skilled workers. Nonetheless, Germany’s labor market remains stable, helping most consumers to weather the economic downturn. According to estimates by experts, the total unemployment rate in 2020 should rise only slightly from 5.0% to 5.1%.
China confirmed that it had agreed to a partial trade deal with the United States, but neither government released the details leaving investors uncertain about the agreement’s significance. One day after President Trump approved the so-called “phase one” accord, the only official word from the White House was a presidential tweet. “We have agreed to a very large Phase One Deal with China. They have agreed to many structural changes and massive purchases of Agricultural Products, Energy, and Manufactured Goods, plus much more. The 25% Tariffs will remain as is, with 7 1/2% put on much of the remainder …”, the president wrote. His multi-part tweet continued “…..The Penalty Tariffs set for December 15th will not be charged because of the fact that we made the deal. We will begin negotiations on the Phase Two Deal immediately, rather than waiting until after the 2020 Election.” An official statement from the office of the U.S. Trade Representative did little to dispel the confusion, offering no specific figures on the agreed Chinese purchases of U.S. farm goods and other products or what structural changes China would make in its economic system.
Japan’s economy expanded at a faster pace in the third quarter than originally reported. Japan’s Cabinet Office reported that Gross Domestic Product grew at an annualized pace of 1.8% in the three months ended September, much higher than the initial reading of 0.2%. The result was stronger than any of the projections made by economists, whose median forecast was for a 0.6% expansion. The better-than-expected reading was driven by stronger capital investment and private consumption ahead of the October 1 sales tax increase. Looking ahead, however, some economists don’t see quite as rosy a picture. “Today’s data is a rear-view mirror image of the economy. What’s important for the BOJ is the landscape in front of it,” said Kyohei Morita, chief Japan economist at Credit Agricole Securities Asia.
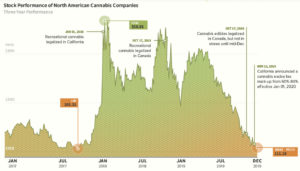
Finally: In 1978 comedians Cheech Marin and Tommy Chong starred in a so-called “stoner” comedy film titled “Up in Smoke”. The 2019 version of the movie could very well refer to money lost in the parabolic rise and subsequent fall of cannabis stocks. The growing acceptance of cannabis for pharmaceutical and other purposes took the investment world by storm, as investors raced to cash in on the “green rush”. Yet, as with almost every investment bubble since the Dutch Tulip Bulb mania of the early 1600s, it seems as though the cannabis bubble has burst—at least for now. The North American Marijuana Index is an equally-weighted index that tracks the stocks of leading companies in the legal cannabis industry in the U.S. and Canada. The index’s inception was January 2nd, 2015 with a starting value of 100 points. After hitting a high of 358.93 in January of 2018, the index has been up and down, with the most recent move a steep collapse down to 111.18. This 70% plunge would no doubt cause Cheech and Chong to say in amazement “Oh wow, man!” Chart from visualcapitalist.com.

(Sources: all index return data from Yahoo Finance; Reuters, Barron’s, Wall St Journal, Bloomberg.com, ft.com, guggenheimpartners.com, zerohedge.com, ritholtz.com, markit.com, financialpost.com, Eurostat, Statistics Canada, Yahoo! Finance, stocksandnews.com, marketwatch.com, wantchinatimes.com, BBC, 361capital.com, pensionpartners.com, cnbc.com, FactSet) Securities offered through Registered Representatives of Cambridge Investment Research Inc., a broker-dealer, member FINRA/SIPC. Advisory Services offered through Cambridge Investment Research Advisors, a Registered Investment Adviser. Strategic Investment Partners and Cambridge are not affiliated.
Indices mentioned are unmanaged and cannot be invested into directly. Past performance is no guarantee of future results. All Investing involves risk. Depending on the types of investments, there may be varying degrees of risk. Investors should be prepared to bear loss, including total loss of principal.
