
12-2-19 Weekly Market Update
The Very Big Picture:
The long-term valuation of the market is commonly measured by the Cyclically Adjusted Price to Earnings ratio, or “CAPE”, which smooths out shorter-term earnings swings in order to get a longer-term assessment of market valuation. A CAPE level of 30 is considered to be the upper end of the normal range, and the level at which further PE-ratio expansion comes to a halt (meaning that increases in market prices only occur in a general response to earnings increases, instead of rising “just because”). The market is currently at that level.
Of course, a “mania” could come along and drive prices higher – much higher, even – and for some years to come. Manias occur when valuation no longer seems to matter, and caution is thrown completely to the wind as buyers rush in to buy first and ask questions later. Two manias in the last century – the 1920’s “Roaring Twenties” and the 1990’s “Tech Bubble” – show that the sky is the limit when common sense is overcome by a blind desire to buy. But, of course, the piper must be paid and the following decade or two are spent in Secular Bear Markets, giving most or all of the mania gains back.
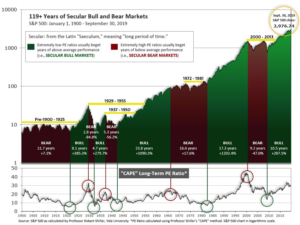
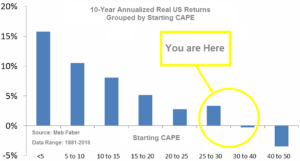
See Fig. 1 for the 100-year view of Secular Bulls and Bears. The CAPE is now at 30.54, up from the prior week’s 30.24, above the level reached at the pre-crash high in October, 2007. Since 1881, the average annual return for all ten year periods that began with a CAPE around this level have been in the 0% – 3%/yr. range. (see Fig. 2).
In the Big Picture:
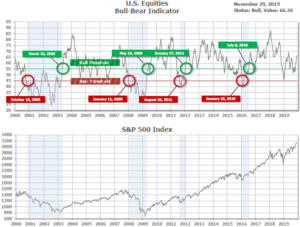
The “big picture” is the months-to-years timeframe – the timeframe in which Cyclical Bulls and Bears operate. The U.S. Bull-Bear Indicator (see Fig. 3) is in Cyclical Bull territory at 66.36, up from the prior week’s 64.57.
In the Intermediate and Shorter-term Picture:
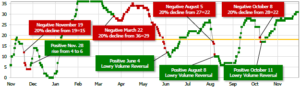
The Shorter-term (weeks to months) Indicator (see Fig. 4) is positive. The indicator ended the week at 31, up from the prior week’s 29. Separately, the Intermediate-term Quarterly Trend Indicator – based on domestic and international stock trend status at the start of each quarter – was positive entering October, indicating positive prospects for equities in the fourth quarter of 2019.
Timeframe Summary:
In the Secular (years to decades) timeframe (Figs. 1 & 2), the long-term valuation of the market is historically too high to sustain rip-roaring multi-year returns. The Bull-Bear Indicator (months to years) remains positive (Fig. 3), indicating a potential uptrend in the longer timeframe. In the intermediate timeframe, the Quarterly Trend Indicator (months to quarters) is positive for Q4, and the shorter (weeks to months) timeframe (Fig. 4) is positive. Therefore, with three indicators positive and none negative, the U.S. equity markets are rated as Positive.
In the Markets:
U.S. Markets: Growing optimism about a “phase one” trade deal between the U.S. and China helped stocks close higher for the holiday-shortened week. The large cap Dow Jones Industrial Average and S&P 500 index each hit record highs, as did the technology-heavy NASDAQ Composite. The Dow Jones Industrial Average added 175 points to close at 28,051, a gain of 0.6%. The NASDAQ added 145 points, to finish the week up 1.7%. By market cap, the large cap S&P 500 rose 1.0%, while the mid cap S&P 400 index and small cap Russell 2000 added 1.2% and 2.2%, respectively.
International Markets: Canada’s TSX retraced all of last week’s decline by rising 0.5%, while across the Atlantic the United Kingdom’s FTSE added 0.3%. On Europe’s mainland, France’s CAC 40 rose 0.2%, Germany’s DAX added 0.6%, and Italy’s Milan FTSE ended the week flat. In Asia, China’s Shanghai Composite fell for a third consecutive week down -0.5%. Japan’s Nikkei finished the week up 0.8%. As grouped by Morgan Stanley Capital International, developed markets rose 0.3%, while emerging markets declined -0.8%.
Commodities: Precious metals finished the week to the upside, with both Gold and Silver gaining 0.6%. Gold finished the week at $1472.70, while Silver closed at $17.11. Oil ended the week down -4.5% to $55.17 per barrel of West Texas Intermediate crude. Copper, viewed by some analysts as a barometer of world economic health due to its wide variety of industrial uses, gained 0.5% for the week.
November Summary: In the U.S., the NASDAQ led to the upside adding 4.5% for the month, followed by the small cap Russell 2000 which added 4.0% and the Dow which gained 3.7%. The benchmark S&P 500 index gained 3.4% while the mid cap S&P 400 added 2.8%. Almost all major international indexes also finished to the upside in November. Canada’s TSX added 3.4% while the UK’s FTSE added 1.4%. France’s CAC 40 added 3.1%, Germany’s DAX gained 2.9%, and Italy’s Milan FTSE added 2.5%. China’s Shanghai Composite was the only major index that finished in the red, down -2.0%, while Japan’s Nikkei rose 1.6%. Emerging markets finished the month down ‑0.1%, while developed markets gained 1.1% during November. Both gold and silver retreated in November, losing -2.8% and -5.3%, respectively, while oil added 1.8% and copper finished the month up 0.8%.
U.S. Economic News: The number of Americans claiming first-time unemployment benefits fell back to near post‑recession lows. The Labor Department reported initial jobless claims declined by 15,000 to 213,000 last week. Economists had forecast new claims would total 220,000. Jobless claims are often volatile during the holiday season so analysts frequently turn to the monthly average of new claims to gauge trends. The 4-week average of new claims fell by 1,900 to 219,750. Continuing claims, which counts the number of people already collecting benefits, declined by 57,000 to 1.64 million. That number is near its lowest level since the early 1970’s.
The Commerce Department reported that sales of newly-constructed homes decreased 0.7% on a monthly basis in October to a seasonally-adjusted annual rate of 733,000. Economists had forecast sales would number 705,000. Notably, this was the first month since 2007 that the annual pace of single-family home sales remained above 700,000 for three consecutive months. The median sales price for a new home was $316,700. The government estimated there was a 5.3 month supply of new homes available for sale, down from 5.5 months in September. Economists generally consider a 6-month supply a “balanced” housing market. Regionally, home sales increased in the West and Midwest, but fell in the Northeast and South.
Home prices continued to rise in September according to the latest home price data. Research firm S&P reported its Case-Shiller metropolitan area home price index rose 0.4% month-over-month, 2.1% higher than the same time last year. Nationwide, home prices were also up 0.4% in September, and up 3.2% over the past year. Phoenix saw the biggest increase in home prices with a 6% increase from last year followed closely by Charlotte, North Carolina (up 4.6%) and Tampa, Florida (up 4.5%). Lynn Fisher, the Federal Housing Finance Agency’s senior advisor for economics noted that homes in costlier states like California and New York are now appreciating at rates that are lower than the national average. “At the same time, out migration from high-cost areas is placing upward pressure on home prices in states like Idaho, Utah, Arizona, New Mexico, Vermont and Maine, which all now rank in the top 10 states by appreciation rate,” she wrote.
Confidence among the nation’s consumers fell for the fourth consecutive month, as Americans expressed more worries about the U.S. labor market. The Conference Board reported its consumer confidence index slipped 0.6 point to 125.5. Economists had expected a reading of 128.2. Just over a year ago, the consumer confidence index hit an 18-year high, but it has steadily fallen in the wake of lingering trade tensions with China. In the details, the way Americans feel about the economy at the moment dipped slightly, however they expect it to improve in the months ahead. The so-called present situation index dipped to 166.9 from 173. Yet the gauge that looks at expectations six months from now rose to 97.9 from 94.5. “Overall, confidence levels are still high and should support solid spending during this holiday season,” said Lynn Franco, director of economic indicators at the privately-run Conference Board.
Despite the lack of confidence reported above by the Conference Board, consumers continued to open their wallets. Consumer spending rose for the eighth consecutive month in October, a good sign for the holiday shopping season. The Commerce Department reported consumer spending increased 0.3% last month, exceeding economists’ forecasts of a 0.2% increase. Also in the report, a key measure of inflation increased by just a few ticks. The Personal Consumption Expenditures Index (PCEI), said to be the Federal Reserve’s “preferred” inflation gauge, rose 0.2%. Inflation has been tame over the past year and showed little sign of becoming a problem for the economy. Over the past year, the PCEI showed prices rising at just 1.3% – well below the central bank’s 2% target.
Orders for long-lasting goods expected to last at least three years, so-called “durable goods”, rose in October, but most of the increase was due to military hardware. The Commerce Department reported orders for durable goods rose 0.6% last month, with most of the gain coming from defense-related purchases such as jet fighters and ships. Stripping out military hardware, orders for consumer products barely rose—up just 0.1%. Economists had forecast a drop of -1.1%. Core orders, which strips out defense spending and commercial aircraft, surged 1.2%–its biggest gain since January. Avery Shenfeld, senior economist at CIBC World Markets stated, “U.S. durable orders showed a bit more durability than we thought in the face of an auto strike and global growth headwinds.”
The U.S. economy grew at a 2.1% annual pace in the third quarter, a few ticks higher than previously estimated by the Bureau of Economic Analysis (BEA). GDP was originally estimated to have grown 1.9%. The main driver of growth, consumer spending, remained at 2.9%, however there were upward revisions in inventories and investment in structures. Exports rose a bit faster at 0.9% while imports advanced 0.8% instead of 0.4% as initially reported. Most other figures in the BEA report were little changed, including inflation.
International Economic News: In a transition to a so-called “clean economy”, the Bank of Canada warned that much of Canada’s natural resources will become “stranded assets”. Bank of Canada Governor Stephen Poloz referred to a report from the bank’s Financial Stability Department, in which senior research director Miguel Molico states that carbon-intensive sectors like oil and gas would be hurt by significant changes in pricing in a transition away from a carbon economy. “Maintaining the warming below 2.0 degrees Celsius implies that some of the existing fossil fuel reserves will become stranded assets,” he wrote. In May, the Bank of Canada for the first time listed climate change among the top worries for the economy as part of its financial system health report.
Research by the think-tank Institute for Public Policy Research (IPPR) showed that parts of England have higher mortality rates than places in Turkey, Romania and Poland, and that the UK is more unequal than comparable countries on measures such as health, jobs, disposable income, and productivity. The report said mortality rates were especially high in Blackpool, Manchester and Hull. Luke Raikes, a senior research fellow at IPPR North, said: “It is no surprise that people across the country feel so disempowered. Both political and economic power are hoarded by a handful of people in London and the south-east and this has damaged all parts of the country, from Newcastle to Newham.” The report stressed that the inequality in Britain is far more complex than a north-south divide or “cities versus towns”.
On Europe’s mainland, France and Germany put aside their differences to call for an overhaul of the European Union, which has been rocked by an influx of migrants, a Eurozone debt crisis, and Brexit. Paris and Berlin, long viewed as the axis of the continent’s post-World War Two unification process, said a “Conference on the Future of Europe” was necessary to make the EU “more united and sovereign” across a range of challenges. The document notes a growing concern that Europe is ill-equipped to deal with new security and economic challenges, especially from an ascendant China. The two-page Franco-German paper said other areas where Europe needed to be more united included its near neighbors, digitalization, climate change, migration, the fight against inequality, the “social market economy” and the rule of law.
China’s economic growth could fall as low as 4% over the next decade, said a leading Chinese economist. Gao Shanwen, chief economist at Essence Securities stated Beijing must address China’s ageing population, debt levels, and falling investment levels in order to sustain growth. Gao said unsustainable investments and accrued risks from past stimulus policies also pose threats to the economy. Gao, a frequent critic of government policies, has made controversial comments on the Chinese economy in the past. In a speech about the US-China trade war in July last year, he said China’s policy of opening up was essentially opening the doors to the United States and warned that Chinese below the age of 30 should brace for a hard life if the tariff battle was not adequately addressed.
Japan’s 2019 growth forecast was cut for the third time this year by the International Monetary Fund (IMF). The IMF reduced its growth forecast from 0.9% to 0.8% for this year, and estimates growth will decelerate to just 0.5% in 2020. IMF Managing Director Kristalina Georgieva called for continued government spending to support growth and prices as the global slowdown weighs on Japan’s domestic economy. The fund also made several recommendations for the Bank of Japan, including the targeting of shorter-term bonds, while reiterating its call for more ambitious structural reforms to boost growth. While also reminding policymakers that at some point they would need to rein in Japan’s gargantuan public debt, the IMF nonetheless said Japan should not tighten its spending stance for now.
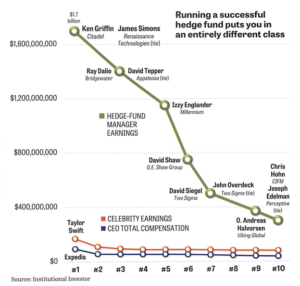
Finally: Bernie Sanders and Elizabeth Warren want to take wealth away from rich corporate tycoons. But wait! Top entertainers and other celebrities make even more than corporate tycoons. Taylor Swift makes much more than even the most outrageously paid CEO – some $170 million in 2016, followed by the band One Direction and various athletes, authors, and TV personalities in that year. But wait! Unknown to most Americans, the top earners by far (and it’s not even close) are the publicity-shy handful of hedge fund managers at the very top of that category. Ken Griffin at Citadel and James Simons at Renaissance Technologies are roughly tied at over $1.7 billion (that’s billion with a b) just for the single year 2016 (the last year for which complete information is available). The graphic below, courtesy of Institutional Investor magazine, shows the stunning comparisons.
(Sources: all index return data from Yahoo Finance; Reuters, Barron’s, Wall St Journal, Bloomberg.com, ft.com, guggenheimpartners.com, zerohedge.com, ritholtz.com, markit.com, financialpost.com, Eurostat, Statistics Canada, Yahoo! Finance, stocksandnews.com, marketwatch.com, wantchinatimes.com, BBC, 361capital.com, pensionpartners.com, cnbc.com, FactSet) Securities offered through Registered Representatives of Cambridge Investment Research Inc., a broker-dealer, member FINRA/SIPC. Advisory Services offered through Cambridge Investment Research Advisors, a Registered Investment Adviser. Strategic Investment Partners and Cambridge are not affiliated.
Indices mentioned are unmanaged and cannot be invested into directly. Past performance is no guarantee of future results. All Investing involves risk. Depending on the types of investments, there may be varying degrees of risk. Investors should be prepared to bear loss, including total loss of principal.