
12-6-2021 Weekly Market Update
The very Big Picture
The long-term valuation of the market is commonly measured by the Cyclically Adjusted Price to Earnings ratio, or “CAPE”, which smooths-out shorter-term earnings swings in order to get a longer-term assessment of market valuation. A CAPE level of 30 is considered to be the upper end of the normal range, and the level at which further PE-ratio expansion comes to a halt (meaning that further increases in market prices only occur as a general response to earnings increases, instead of rising “just because”). The market is now above at that level.
Of course, a “mania” could come along and drive prices higher – much higher, even – and for some years to come. Manias occur when valuation no longer seems to matter, and caution is thrown completely to the wind – as buyers rush in to buy first, and ask questions later. Two manias in the last century – the “Roaring Twenties” of the 1920s, and the “Tech Bubble” of the late 1990s – show that the sky is the limit when common sense is overcome by a blind desire to buy. But, of course, the piper must be paid, and the following decade or two were spent in Secular Bear Markets, giving most or all of the mania-gains back.
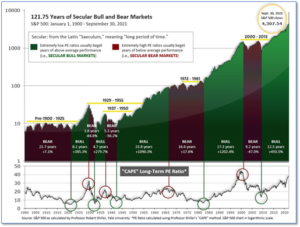
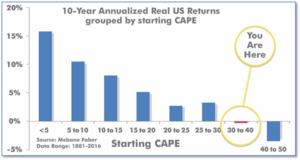
See Fig. 1 for the 100-year view of Secular Bulls and Bears. The CAPE is now at 38.29, down from the prior week’s 38.77. Since 1881, the average annual return for all ten-year periods that began with a CAPE in this range has been negative (see Fig. 2).
Note: We do not use CAPE as an official input into our methods. However, if history is any guide – and history is typically ‘some’ kind of guide – it’s always good to simply know where we are on the historic continuum, where that may lead, and what sort of expectations one may wish to hold in order to craft an investment strategy that works in any market ‘season’ … whether the current one, or one that may be ‘coming soon’!
The Big Picture:
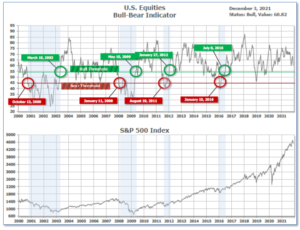
The ‘big picture’ is the (typically) years-long timeframe – the timeframe in which Cyclical Bulls and Bears operate. The U.S. Bull-Bear Indicator is in Cyclical Bull territory at 60.82, down from the prior week’s 64.68.
In the Quarterly- and Shorter-term Pictures
The Quarterly-Trend Indicator based on the combination of U.S. and International Equities trend-statuses at the start of each quarter – was Positive entering October, indicating positive prospects for equities in the fourth quarter of 2021.
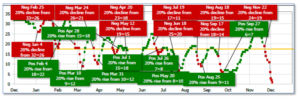
Next, the short-term(weeks to months) Indicator for US Equities turned negative on November 22 and ended the week at 1, down sharply from the prior week’s 12.
In the Markets:
U.S. Markets: All of the major U.S. indexes finished the week to the downside. The Dow Jones Industrial Average fell 319 points finishing the week at 34,580—a decline of -0.9%. The technology-heavy NASDAQ Composite declined a second week giving up -2.6%. By market cap, the large cap S&P 500 retreated -1.2%, while the mid cap S&P 400 and small cap Russell 2000 declined -2.8% and -3.9%, respectively.
International Markets: International markets finished the week mixed. Canada’s TSX fell -2.3%, while the United Kingdom’s FTSE 100 rose 1.1%. France’s CAC 40 rose 0.4%, but Germany’s DAX declined -0.6%. China’s Shanghai Composite added 1.2%, but Japan’s Nikkei declined -2.5%. As grouped by Morgan Stanley Capital International developed markets ticked down -0.1%, while emerging markets finished the week up 0.5%.
Commodities: Major commodities finished the week to the downside. Gold ticked down -0.1% to $1783.90 per ounce, while Silver fell a steeper -2.7% to $22.48. Oil fell for a sixth consecutive week. West Texas Intermediate crude oil declined -2.8% to $66.26 per barrel. The industrial metal copper, viewed by some analysts as a barometer of world economic health due to its wide variety of uses, ended the week down -0.6%.
November Summary: For the month of November all but 1 of the major U.S. indexes finished in the red. The Dow Jones Industrial Average shed -3.7%, while the Nasdaq Composite managed a 0.3% gain. The large cap S&P 500 declined -0.8%, while mid caps and small caps were the hardest hit, declining -3.1% and -4.3% respectively. Almost all major international indexes finished the month of November to the downside. Canada’s TSX declined -1.8% and the United Kingdom’s FTSE 100 gave up -2.5%. France’s CAC 40 and Germany’s DAX ended down -1.6% and -3.8%, respectively, while in Asia, China’s Shanghai Composite was the lone gainer, adding 0.5%. Japan’s Nikkei ended November down -3.7%. Developed markets and emerging markets ended the month down -4.5% and -4.1%, respectively. Like equities, November was a difficult month for commodities. Gold and silver declined -0.4% and -4.7%, respectively, while copper pulled back 2%. Oil finished the month down a huge -20.8%.
U.S. Economic News: The number of Americans filing first-time unemployment benefits jumped in late November; however analysts are questioning the validity of the reading given the volatility of these reports around holidays like Thanksgiving. The Labor Department reported new claims for benefits jumped by 28,000 to 220,000 last week. Still, claims remain near their pandemic lows in the low 200,000’s. Meanwhile, continuing claims, which counts the number of people already collecting benefits, fell by 107,000 to 1.96 million. This is the first time that number has fallen below 2 million during the pandemic. Robert Frick, corporate economist at Navy Federal Credit Union stated, “Factoring out the previous week’s adjustment noise, which pushed the count artificially low, today’s release of initial unemployment claims puts us almost back to pre-pandemic levels.”
The U.S. gained a meager 210,000 new jobs in November, a disappointing increase that shows the worst labor shortage in decades is still weighing on the economic recovery. The increase in hiring was far below economists’ forecasts. The consensus was for 573,000 new jobs. The U.S. jobless rate, meanwhile, fell to 4.2% from 4.6% and touched a new pandemic low. Also in the report, the size of the labor force grew substantially as some 594,000 people rejoined the labor force in November. The so-called rate of participation rose two ticks to 61.8% and reached the highest level since the start of the pandemic. The biggest job gains took place in white-collar professional jobs and warehouse and transportation. Employment also grew steadily in construction and manufacturing. Retailers and government cut jobs in November.
The number of home sales in which a contract has been signed, but the deal not yet closed, surged in October – far exceeding economists’ expectations. The National Association of Realtors (NAR) reported pending home sales rose 7.5%, far above the 0.7% increase analysts had expected. Compared with the same time last year, however, pending sales were down 1.4%–reflecting how much home-buying activity has cooled from the frenzy of 2020. Lawrence Yun attributed the increase in contract signings to fast-rising rents and the anticipated increase in mortgage rates. Every region saw an increase in sales, led by an 11.8% gain in the Midwest. Yun added that the report solidified projections that existing home sales will exceed an annual rate of 6 million for 2021.
The pace of home price appreciation slowed in September, according to S&P CoreLogic. S&P’s Case-Shiller 20-city home price index posted a 19.1% year-over-year gain in September, down 0.5% from the previous month. On a monthly basis the index increased 0.8% between August and September. The separate national index showed a 19.5% gain—down 0.3% from its previous reading. Phoenix led the country in home-price growth with a 33.1% increase, followed by Tampa and Miami. Just six of the 20 major cities that the report tracks recorded larger price increases in September than in August, though all cities did continue to notch increases.
Confidence among the nation’s consumers fell to a 9-month low as concerns over rising inflation and a resurgence in coronavirus cases weighed on sentiment. The Conference Board reported its index of consumer confidence dropped 2.1 points to 109.5 in November. It was the fourth decline in the past five months. Economists had expected a reading of 110. Lynn Franco, senior director of economic indicators at the board stated, “Concerns about rising prices–and, to a lesser degree, the Delta variant–were the primary drivers of the slight decline in confidence.” Note that data for this report was before the outbreak of the new ‘Omicron’ variant of the coronavirus. Analysts don’t expect sentiment to improve soon. Chief economist Joshua Shapiro of MFR Inc. wrote in a research note, “Supply chain disruptions, inflation, economic policy concerns, and a stubborn pandemic are all likely to continue to weigh on consumer confidence and sentiment in the months ahead.”
A closely-watched index of manufacturing activity rose in November on news supply chain disruptions may be easing. The Institute for Supply Management (ISM) reported its manufacturing index rose 0.3% to 61.1% in November. The reading matched forecasts. Note that readings above 50% signify growth and this the 18th consecutive month in which the index has been above that level. In the report, new orders and production both rose in November, and the sub-index that tracks employment rose to 53.3% from 52%. Ian Shepherdson, chief economist at Pantheon Economics said, “The supply-chain measures in the survey all eased in November, though they remain elevated. All these numbers peaked in the spring, suggesting that the worst of the supply-chain crisis is over, though it will be a while before normal conditions are fully restored.”
The Federal Reserve’s ‘Beige Book’, a collection of anecdotal reports from each of its member banks, found “widespread” price hikes with “little pushback” from consumers. “Prices rose at a moderate to robust pace, with price hikes widespread across sectors of the economy,” the survey found. Increases in input costs were “wide-ranging” due to strong demand for raw materials, logistical challenges and labor market tightness, the report said. Tight labor markets meant wages were also rising at a “robust” pace across most of the Fed’s 12 districts, according to the report.
International Economic News: The Canadian economy roared back in the third quarter on a rebound in consumer spending and manufacturing activity. Statistics Canada reported Canada’s economy grew an annualized 5.4% in the third quarter, beating analyst expectations for a gain of 3.0%. The third-quarter rebound was driven by one of the largest household spending sprees on record as COVID-19 restrictions were eased. Exports were also up, led by crude oil. With the October gain, economic activity is now just 0.5% below pre-pandemic levels.
Across the Atlantic, the Organization for Economic Cooperation and Development (OECD) stated the United Kingdom is headed for the fastest growth in its Group of Seven (G7) major economies this year but will suffer a setback if supply shortages persist. A lack of workers to fill open jobs and persistent disruptions in the flow of goods across borders could force companies to reduce output, damaging the pace of recovery in the economy, the Paris-based researcher concluded in its report. The OECD cut its growth forecast for the U.K. next year to 4.9% from 5.2%–that’s still the fastest in the G-7. Growth this year will be better than previously estimated at 6.9% rather than 6.7%.
On Europe’s mainland, Germany decided this week to bar its unvaccinated citizens from all but the most essential business to curb the spread of the Omicron variant of the coronavirus. The new measures will allow the unvaccinated only in essential businesses such as grocery stores and pharmacies. Legislation to make vaccination mandatory will be drafted for early in 2022. “We have understood that the situation is very serious,” Chancellor Angela Merkel told a news conference. A nationwide vaccination mandate could take effect from February 2022 after it is debated in the Bundestag and after guidance from Germany’s Ethics Council, she said.
In Asia, advisers to China’s government will recommend authorities set its economic growth target for 2022 below the one set for 2021, giving policymakers more room to push through structural reforms. Advisers told Reuters they drafted recommendations for annual economic growth targets ranging from as low as 5% to 5.5%, down from the “above 6%” target set for 2021. The advisers make policy proposals to the government but are not part of the final decision-making process. A poll in October showed economists expect China’s growth to slow to 5.5% in 2022, but some analysts have since trimmed forecasts on new risks such as a deteriorating real estate sector. The new Omicron coronavirus variant is also an added risk.
The OECD stated Japan must maintain its expansive fiscal policy until its economic recovery from the pandemic is on track and not pull back stimulus too soon. Fiscal policy should continue to support the economy in the near term, the OECD said in its report. OECD Secretary-General Mathias Cormann noted Japan’s debt has grown to more than twice the size of its gross domestic product (GDP). The best way for reducing that ratio is by strengthening the growth of the economy, he added. The world’s third-largest economy shrank an annualized 3.0% in the third quarter due to weak consumption and supply shortages but is forecast to bounce back in the current quarter.
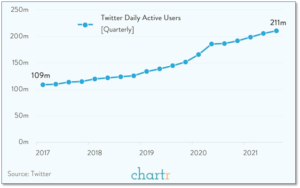
Finally: This week Jack Dorsey resigned from his role as CEO of Twitter. For over 15 years Dorsey has been an iconic figure in Silicon Valley. Under his leadership, Twitter implemented wide censorship on its platform, which appeared to many to be mostly directed at conservatives. To some, he is “Saint Jack”, to others, “Jack the Ripper”. Despite his controversial tenure, what isn’t up for debate is the steady consistent growth Twitter has shown over the past several years. Daily active users almost doubled from 109 million in 2017 to over 210 million in 2021. (Data: twitter, Chart: chartr.co)
(Sources: All index- and returns-data from Yahoo Finance; news from Reuters, Barron’s, Wall St. Journal, Bloomberg.com, ft.com, guggenheimpartners.com, zerohedge.com, ritholtz.com, markit.com, financialpost.com, Eurostat, Statistics Canada, Yahoo! Finance, stocksandnews.com, marketwatch.com, wantchinatimes.com, BBC, 361capital.com, pensionpartners.com, cnbc.com, FactSet.) Securities offered through Registered Representatives of Cambridge Investment Research Inc., a broker-dealer, member FINRA/SIPC. Advisory Services offered through Cambridge Investment Research Advisors, a Registered Investment Adviser. Strategic Investment Partners and Cambridge are not affiliated. Indices mentioned are unmanaged and cannot be invested into directly. Past performance is no guarantee of future results.