
11-29-2021 Weekly Market Update
The very Big Picture
The long-term valuation of the market is commonly measured by the Cyclically Adjusted Price to Earnings ratio, or “CAPE”, which smooths-out shorter-term earnings swings in order to get a longer-term assessment of market valuation. A CAPE level of 30 is considered to be the upper end of the normal range, and the level at which further PE-ratio expansion comes to a halt (meaning that further increases in market prices only occur as a general response to earnings increases, instead of rising “just because”). The market is now above at that level.
Of course, a “mania” could come along and drive prices higher – much higher, even – and for some years to come. Manias occur when valuation no longer seems to matter, and caution is thrown completely to the wind – as buyers rush in to buy first, and ask questions later. Two manias in the last century – the “Roaring Twenties” of the 1920s, and the “Tech Bubble” of the late 1990s – show that the sky is the limit when common sense is overcome by a blind desire to buy. But, of course, the piper must be paid, and the following decade or two were spent in Secular Bear Markets, giving most or all of the mania-gains back.
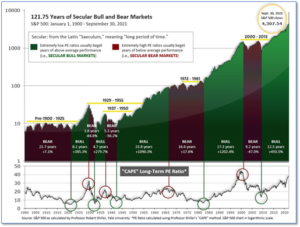
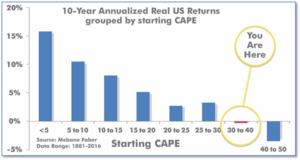
See Fig. 1 for the 100-year view of Secular Bulls and Bears. The CAPE is now at 38.77, down from the prior week’s 39.64. Since 1881, the average annual return for all ten-year periods that began with a CAPE in this range has been negative (see Fig. 2).
Note: We do not use CAPE as an official input into our methods. However, if history is any guide – and history is typically ‘some’ kind of guide – it’s always good to simply know where we are on the historic continuum, where that may lead, and what sort of expectations one may wish to hold in order to craft an investment strategy that works in any market ‘season’ … whether the current one, or one that may be ‘coming soon’!
The Big Picture:
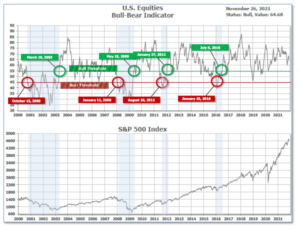
The ‘big picture’ is the (typically) years-long timeframe – the timeframe in which Cyclical Bulls and Bears operate. The U.S. Bull-Bear Indicator is in Cyclical Bull territory at 64.68, down from the prior week’s 68.22.
In the Quarterly- and Shorter-term Pictures
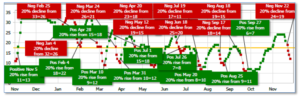
The Quarterly-Trend Indicator based on the combination of U.S. and International Equities trend-statuses at the start of each quarter – was Positive entering October, indicating positive prospects for equities in the fourth quarter of 2021.
Next, the short-term(weeks to months) Indicator for US Equities turned negative on November 22 and ended the week at 12, down sharply from the prior week’s 21.
In the Markets:
U.S. Markets: U.S. stocks declined in the holiday-shortened week as news about the emergence of a new, potentially more contagious, coronavirus variant in South Africa triggered a sharp sell-off in equities around the world. The Dow Jones Industrial Average declined 703 points for the week closing at 34,899, a decline of -2.0%. The technology-heavy NASDAQ Composite retreated -3.5% to 15,492. By market cap, the large cap S&P 500 ended down -2.2%, while the mid cap S&P 400 and small cap Russell 2000 declined -3.2% and -4.1%, respectively.
International Markets: Almost all major international markets finished the week in the red. Canada’s TSX declined for a second week, giving up -2.0%, while the United Kingdom’s FTSE 100 fell -2.5%. On Europe’s mainland, France’s CAC 40 and Germany’s DAX plunged -5.2% and -5.6% respectively. China was the only major market to finish the week in the green. China’s Shanghai Composite ticked up a bare 0.1%. Japan’s Nikkei ended down -3.3%. As grouped by Morgan Stanley Capital International, developed markets retreated -4.0%, while emerging markets declined -4.4%.
Commodities: Precious metals were no “safe haven”, and sold off along with equities. Gold pulled back ‑3.6% to $1785.50 per ounce, while Silver declined a much larger -6.8% to $23.11. The industrial metal copper, viewed by some analysts as a barometer of world economic health due to its wide variety of uses, declined for a second week, down ‑2.6%. Oil sold off over concerns of travel restrictions due to the new COVID variant. West Texas Intermediate crude oil fell for a fifth consecutive week, plunging -10.3% to $68.15 per barrel.
U.S. Economic News: The number of Americans filing for first-time unemployment benefits plunged to its lowest level since 1969 last week. The Labor Department reported just 199,000 people filed for benefits, far below the consensus forecast of 260,000. Unemployment filings had been steadily moving toward pre-crisis lows, when they were in the low 200,000s. They totaled as much as 900,000 a week at the start of the year. Meanwhile, the number of people already collecting benefits, so-called “continuing claims”, fell by 60,000 to 2.05 million. That number is also at a pandemic low. Rubeela Farooqi, chief U.S. economist at High Frequency Economics, writing about first-time filings, stated “the level has moved below the 218,000 average seen in 2019, a solidly positive signal about the labor market.”
Sales of existing homes moved higher in October underscoring the robust demand for housing across the country. The National Association of Realtors (NAR) reported existing home sales increased 0.8% between September and October hitting a seasonally-adjusted annual rate of 6.34 million. Economists had expected sales to come in at a 6.2 million rate. Lawrence Yun, NAR chief economist, said in the report “Home sales remain resilient, despite low inventory and increasing affordability challenges.” The median price for an existing home sold in October was $353,900, up more than 13% from a year ago. Unsold inventory was at a 2.4-month supply—a 6-month supply of homes is generally considered to be a sign of a balanced market. Yun also noted that inflationary pressure may be encouraging people to choose to buy a home rather than rent for the security of a fixed monthly payment.
The U.S. economy gained momentum last month according to an index compiled by the Federal Reserve Bank of Chicago. The Chicago Fed’s National Activity Index (CFNAI) rose to 0.76 in October from -0.18 in September, exceeding the consensus forecast of 0.17. The CFNAI is composed of 85 economic indicators drawn from four broad categories of data: production and income; employment, unemployment and hours; personal consumption and housing; and sales, orders and inventories. A positive reading signals growth above the historical trend and a negative reading corresponds to growth below trend. All four broad categories of indicators used to construct the index made positive contributions to it in October, and all four categories improved from the prior month, the Chicago Fed reported.
Data analytics firm IHS Markit reported U.S. businesses grew rapidly this month, but labor and supply shortages continue to weigh on the economic recovery. Markit’s flash survey of U.S. manufacturers rose 0.7 point to a two-month high of 59.1, while a similar survey of service-oriented companies slid to a two-month low of 57—down 1.7 points. Still, any reading above 50 signals growth and readings above 55 are considered exceptional. Chris Williamson, chief business economist at IHS Markit wrote, “The US economy continues to run hot. Growth remains above the survey’s long-run pre-pandemic average as companies continue to focus on boosting capacity to meet rising demand.”
Orders for goods expected to last at least three years, so-called “durable goods”, fell last month but economists were quick to point out the report wasn’t as bad as the headline suggested. The Census Bureau reported orders fell 0.5% in October, missing estimates of a 0.3% increase. However, the decline stemmed almost entirely from fewer orders for passenger airplanes. Excluding the transportation category, orders rose a solid 0.5%. Over the past year orders for durable goods have risen by almost 14% and easily exceed pre-pandemic levels. New orders were fairly strong outside transportation. Demand also rose for industrial metals, metal parts, electronics, appliances, electrical equipment and networking gear.
Spending among the nation’s consumers continued to rise, however consumers didn’t get as much bang for their buck. Consumer spending climbed 1.3% in October, beating forecasts of a 1.0% increase. However, higher prices accounted for about half the gain. After factoring in inflation, consumer spending rose a more modest 0.7%. Consumer spending is the main engine of the U.S. economy and so far rising prices have not deterred Americans from buying more goods and services. Gus Faucher of PNC Financial Services noted “Watch what consumer do, not what they say. Although consumer confidence has declined in the fall because of high inflation, households continue to spend.”
Officials at the Federal Reserve expressed greater worries about the surge of inflation at their meeting earlier this month, raising the possibility of the Fed ending its bond purchases sooner than previously hinted. Most senior officials at the central bank still expect price rises to slow next year, minutes of the Fed’s Nov. 2-3 meeting showed, but they also acknowledged “inflation pressures could take longer to subside” than they previously believed due to ongoing labor and supply shortages. These shortages have pushed the annual rate of inflation to a 31-year high of 6.2%, from just over zero a little over a year ago. Some analysts say the Fed could take that step as soon as its Dec. 14-15 meeting based on the most recent public comments of senior officials.
International Economic News: Canada’s parliament formally opened this week following the September elections. The minority government headed by Prime Minister Justin Trudeau presented an agenda focused on making economic growth, inflation pressures, climate change, and reconciliation with indigenous communities its focus. The outline of what Justin Trudeau plans to achieve in the near future was presented by Canada’s governor-general Mary Simon in her Speech from the Throne. The speech will be debated in the House of Commons and could result in the new government facing its first vote of confidence, as it will require the support of either the opposition Bloc Quebecois or the New Democratic Party (NDP) to get it passed. Trudeau’s ruling Liberal Party is 10 short of the 170 seats required for a majority.
The economic fallout from the coronavirus has made Britain’s workforce smaller, younger, and more diverse according to a recent report. The Resolution Foundation said that while mass unemployment had been avoided during the Covid-19 emergency, there has been a large increase in people who have exited the workforce and are no longer looking for a job. Reflecting a sharp rise in early retirement among older workers, the think tank said economic inactivity–a measure of people out of a job, but who are not looking for work–had soared by 586,000 since the start of the crisis. It said these trends had led to a shrinking of Britain’s workforce, leaving a more concentrated number of women and younger adults to form the backbone of the UK economy.
The dispute over licenses given to French fishermen to fish in British waters continued to escalate as French fishermen temporarily blockaded the port of Calais and Channel Tunnel disrupting the flow of goods between France and the United Kingdom. Last week, France said it was still waiting for 150 licenses from Britain and the Channel Islands. Britain, meanwhile, says only the vessels lacking the correct documentation are missing out on relevant licenses. Jean Luc Hall, director-general of the National Committee for Maritime Fisheries and Marine Farming, said, “Our coordinated action is intended to show that we have the capacity to block the ports, block the Channel Tunnel and therefore paralyze the British economy. The idea is not to cause harm, but to show that we have the capacity to react.” Mr. Hall hopes to get “British authorities to reflect on the issue”.
Europe’s largest economy is on track to stagnate in the final quarter of this year as supply chain bottlenecks show no sign of easing up, Ifo economist Klaus Wohlrabe said. Wohlrabe said the fall in Germany’s business climate index in November gave the economic institute cause for concern. Ifo’s business climate index fell to 96.5 in November from 97.7 in October, marking the fifth consecutive decline and the worst reading since February. The Ifo Institute said supply bottlenecks and the fourth wave of the coronavirus are threatening Germany’s economic recovery. Ifo is concerned the country may impose restrictions on business and consumer activity as neighboring Austria has done.
In Asia, carbon dioxide emissions from the China, the world’s second-largest economy, have fallen for the first time since last year’s lockdown. According to data published by Carbon Brief, a climate research and news service, emissions declined by about 0.5% in the third quarter. Lauri Myllyvirta, an analyst at the Centre for Research on Energy and Clean Air stated, “The reasons [for the decline] are the clampdown on runaway real estate lending, resulting in a sharp reduction in steel and cement output, and the sky-high coal prices.”
Japan’s new economic security minister downplayed concerns about regulations that could hamper international commerce, saying repeatedly Japan’s commerce was based on a robust free market. Former finance ministry official Takayuki Kobayashi, who was appointed to his new position last month, stated “the basic principle is that business is free. Our country can’t prosper without that. When looking at areas to be protected or strengthened, like supply chains, we must communicate with private sector companies.” Kobayashi is charged with adding an economic perspective to national security strategy and drawing up legislation on bolstering supply chains, ensuring the safety of core infrastructure, nurturing advanced technology and protecting patents.
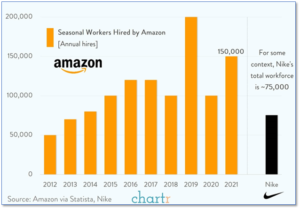
Finally: At the end of September, Amazon employed almost 1.5 million people around the world, with nearly a million in the U.S. alone. That translates to roughly 1 in every 150 American workers getting a paycheck from Jeff Bezos and company. During the holidays that number goes up even more. This year, Amazon announced it would take on another 150,000 seasonal employees—that’s essentially the equivalent of hiring the entire workforce of a company like Nike – twice. (Chart by chart.co)
(Sources: All index- and returns-data from Yahoo Finance; news from Reuters, Barron’s, Wall St. Journal, Bloomberg.com, ft.com, guggenheimpartners.com, zerohedge.com, ritholtz.com, markit.com, financialpost.com, Eurostat, Statistics Canada, Yahoo! Finance, stocksandnews.com, marketwatch.com, wantchinatimes.com, BBC, 361capital.com, pensionpartners.com, cnbc.com, FactSet.) Securities offered through Registered Representatives of Cambridge Investment Research Inc., a broker-dealer, member FINRA/SIPC. Advisory Services offered through Cambridge Investment Research Advisors, a Registered Investment Adviser. Strategic Investment Partners and Cambridge are not affiliated. Indices mentioned are unmanaged and cannot be invested into directly. Past performance is no guarantee of future results.