
12-13-2021 Weekly Market Update
The Very Big Picture
The long-term valuation of the market is commonly measured by the Cyclically Adjusted Price to Earnings ratio, or “CAPE”, which smooths-out shorter-term earnings swings in order to get a longer-term assessment of market valuation. A CAPE level of 30 is considered to be the upper end of the normal range, and the level at which further PE-ratio expansion comes to a halt (meaning that further increases in market prices only occur as a general response to earnings increases, instead of rising “just because”). The market is now above at that level.
Of course, a “mania” could come along and drive prices higher – much higher, even – and for some years to come. Manias occur when valuation no longer seems to matter, and caution is thrown completely to the wind – as buyers rush in to buy first, and ask questions later. Two manias in the last century – the “Roaring Twenties” of the 1920s, and the “Tech Bubble” of the late 1990s – show that the sky is the limit when common sense is overcome by a blind desire to buy. But, of course, the piper must be paid, and the following decade or two were spent in Secular Bear Markets, giving most or all of the mania-gains back.
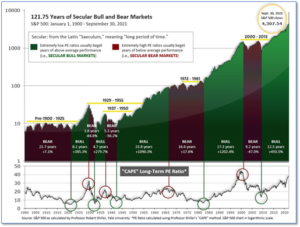
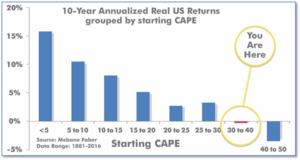
See Fig. 1 for the 100-year view of Secular Bulls and Bears. The CAPE is now at 39.53, up from the prior week’s 38.29. Since 1881, the average annual return for all ten-year periods that began with a CAPE in this range has been negative (see Fig. 2).
Note: We do not use CAPE as an official input into our methods. However, if history is any guide – and history is typically ‘some’ kind of guide – it’s always good to simply know where we are on the historic continuum, where that may lead, and what sort of expectations one may wish to hold in order to craft an investment strategy that works in any market ‘season’ … whether the current one, or one that may be ‘coming soon’!
The Big Picture:
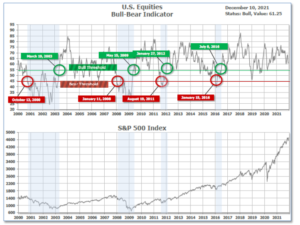
The ‘big picture’ is the (typically) years-long timeframe – the timeframe in which Cyclical Bulls and Bears operate. The U.S. Bull-Bear Indicator is in Cyclical Bull territory at 61.25, up from the prior week’s 60.82.
In the Quarterly- and Shorter-term Pictures
The Quarterly-Trend Indicator based on the combination of U.S. and International Equities trend-statuses at the start of each quarter – was Positive entering October, indicating positive prospects for equities in the fourth quarter of 2021.
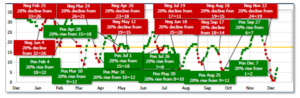
Next, the short-term(weeks to months) Indicator for US Equities turned positive on December 7 and ended the week at 7, up sharply from the prior week’s 1.
In the Markets:
U.S. Markets: The benchmark S&P 500 Index hit new highs last week as fears of the virulence of the latest COVID-19 ‘Omicron’ variant subsided. The Dow Jones Industrial Average rallied over 1,390 points to finish the week at 35,971–a gain of 4.0%. The technology-heavy NASDAQ Composite rallied 3.6% closing at 15,631. By market cap, the large cap S&P 500 finished the week up 3.8%, while the mid cap S&P 400 added 2.9%. The small cap Russell 2000 was the laggard finishing up 2.4%.
International Markets: Almost all major international markets finished the week in the green as markets recovered from varying degrees of sell-offs over the last 3 weeks. Canada’s TSX finished the week up 1.2%, while the United Kingdom’s FTSE 100 gained 2.4%. On Europe’s mainland, France’s CAC 40 rallied 3.3% and Germany’s DAX added 3.0%. In Asia, China’s Shanghai Composite finished the week up 1.6%, its fifth consecutive week of gains. Japan’s Nikkei added 1.5%. As grouped by Morgan Stanley Capital International, developed markets rose 2.6% and emerging markets gained 2.4%.
Commodities: Precious metals finished the week mixed with Gold ticking up 0.05% to $1784.80 per ounce, while Silver pulled back -1.3% to $22.20. Crude oil rebounded from six weeks of solid selling. West Texas Intermediate crude oil rallied 8.2% to finish the week at $71.67 per barrel. The industrial metal copper gained 0.5%.
U.S. Economic News: The number of Americans filing for first-time unemployment benefits fell to a 52-year low of just 184,000 last week. However, the reading is predominantly due to the government’s method of smoothing the data to take into account the big swings in seasonal hiring around the holidays. Still, the data is consistent with the fact that companies remain reluctant to lay off workers amid the biggest shortage of labor in decades. By region, new jobless claims fell the most in the states of Virginia and North Carolina. They rose the most in California, New York and Texas. Meanwhile, continuing claims, which counts the number of people already receiving benefits, rose by 38,000 to 1.95 million. That number also remains near pre-pandemic lows.
American workers continued to quit their jobs at a record pace, giving rise to what experts are calling “The Great Resignation”. The Labor Department reported 4.2 million workers quit their jobs in October following a record-setting 4.4 million in September. The chief reason the majority of people are quitting is because they are finding better or higher paying jobs. Job openings rose to 11 million—the second highest on record. Companies continue to boost wages and benefits in an effort to attract or retain workers amid the biggest labor shortage in decades. Analysts note that normally a record number of job openings sounds like very good news, but not in this case. As Jennifer Lee, senior economist at BMO Capital Markets, writes, “No employer is in a celebratory mood. It is difficult to fill orders or meet customer demands if there are not enough people to do the actual work.” Average hourly pay rose by 4.8% in the 12 months ended in November—one of the highest rates of increase ever.
The cost of living climbed again last month, lifting the rate of inflation to a nearly 40-year high. The Bureau of Labor Statistics reported its consumer price index increased 0.8% last month, outpacing economists’ forecasts of a 0.7% gain. Over the past year, the pace of inflation jumped 0.6% to 6.8%. That’s more than triple the Federal Reserve’s stated target rate of 2%. Likewise, core inflation, which strips out the volatile food and energy categories, climbed to 4.9% from 4.6%. The last time the core rate near 5% was in mid-1991. Analysts state the recent higher-than-expected inflation readings is likely to push the Federal Reserve to speed up its plans to phase out stimulus by the early spring—several months earlier than it had planned. Senior economist Sal Guatieri of BMO Capital Markets wrote in a note, “The Fed has little choice but to accelerate tapering and prepare for the possibility of much earlier rate hikes than it was planning just a few months ago.”
Sentiment among the nation’s consumers rebounded in December but rising inflation may make the bounce rather short-lived. The University of Michigan reported its measure of consumer sentiment rose 3 points to 70.4 in December, but that remains far below where it was this time last year when the index was 80.7. Economists had expected a reading of 68.0. The gauge of how consumers feel about current conditions rose a point to 74.6, while the indicator that measure expectations for the next 6 months added 4.3 points to 67.8. Inflation continues to be consumers’ primary concern about the economy.
U.S. consumer credit increased by $16.9 billion in October, down from a $27.8 billion gain in September, the Federal Reserve reported. Economists had expected a $25 billion gain. The annual growth rate declined 3% to 4.7% in October. Revolving credit such as credit cards rose 7.8%, following an 11.7% gain in September. Non-revolving credit, like auto and student loans, rose 3.7% after a 6.5% gain the prior month.
International Economic News: Analysts at the Royal Bank of Canada’s (RBC) economic research department released a report noting that while the COVID-19 pandemic caused one of the worst recessions in history, the recovery represents an opportunity for a “great Canadian restart”. Canada’s economy averaged annual growth of 2.1% between 2010 and 2019, according to data from Statistics Canada. RBC’s report offers a path that policy-makers could take if they want to boost the country’s potential growth rate. The report suggested policy-makers adopt new approaches to innovation, protect the country’s intellectual property, attract new sources of talent, and enable lifelong learning for its workforce.
Across the Atlantic, the British Chamber of Commerce is now expecting the UK economy will grow at a slower pace than expected next year, with trade set to lag “significantly”. The BCC said economic growth was projected to slow down to 4.2% in 2022, compared to its previous forecast of 5.2%. The downgrade largely reflects a softer outlook for consumer spending amid an anticipated “running down” of household savings built up during lockdowns. If the current global supply chain disruption eases in the second half of 2022, inflation is expected to drift back towards the Bank of England’s 2% target by the middle of 2023, the report said.
On Europe’s mainland, French President Emmanuel Macron stated the European Union needs to rethink its budget framework and alter deficit rules to encourage post-pandemic investment and foster growth as it emerges from the coronavirus pandemic. “The new rules must be more simple and transparent”, Macron said. Furthermore, Macron stated the bloc’s leaders should discuss whether a major stimulus package agreed to last year is enough and what national investment could be allowed beyond budget cap rules. Macron said he wants European leaders “to make Europe a great continent of production, innovation and job creation.”
After months of supply disruptions, German exporters have painstakingly recovered their pandemic losses–however analysts noted the new ‘Omicron’ coronavirus variant will undoubtedly weigh on growth. In the latest report, exports were up 3.8% from early 2020, just before COVID-related restrictions were introduced in Germany. However, new orders for manufactured goods declined amid weak demand. The latest figures suggest Europe’s largest economy finds itself on weak footing heading into the final months of the year and an outbreak of the new variant of the coronavirus is sure to weigh even heavier.
In Asia, the Chinese Academy of Social Sciences (CASS), a top government think-tank stated the world’s second-largest economy is expected to have expanded by about 8% this year. However, ongoing stress in China’s property sector is likely to slow down the country’s economic growth next year. In its latest annual “blue book” on the economy, CASS stated the property downturn was likely to weigh on the expenditures of local governments next year. China’s economy is expected to grow about 5.3% in 2022 bringing the average annual growth rate forecast for 2020-2022 to 5.2%, CASS said. CASS urged China’s central government to proactively engineer a soft landing for the property sector.
A surge of coronavirus cases this summer and the associated drop in consumer spending caused Japan’s economy to shrink faster than estimated during the third quarter, Japan’s government reported. Japan’s Cabinet Office reported gross domestic product contracted an annualized 3.6% during the July to September period. That was worse than the 3.0% projected by the government’s preliminary reading. The faster rate of contraction corresponds to a period in which Tokyo hosted the Olympic Games without fans and shortly afterwards, when daily Covid-19 infections soared in big cities. Takashi Miwa, chief economist at Nomura Securities, said that private consumption and public investment had hit third-quarter GDP as the country’s fifth coronavirus wave coincided with difficulties across global supply chains.
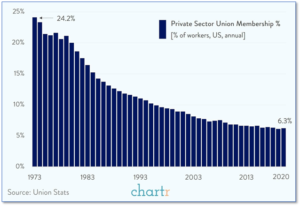
Finally: A Starbucks location in Buffalo, NY, voted for unionization during the past week. It was the first time a union won the right to represent Starbucks workers in that company’s history. Starbucks has an army of 235,000 workers in the U.S. and Starbucks management has spent significant resources over the years successfully dissuading its stores from unionizing. Is this a sign of a turn in the fortunes of union membership? Over the past 50 years, private sector unionization has collapsed. Private sector unionization has dropped by almost three fourths, from about 24% in the early 70’s to about 6% currently. If the Starbucks vote is a sign of things to come, there’s a long road back to previous glory! (Chart from chartr.co)
(Sources: All index- and returns-data from Yahoo Finance; news from Reuters, Barron’s, Wall St. Journal, Bloomberg.com, ft.com, guggenheimpartners.com, zerohedge.com, ritholtz.com, markit.com, financialpost.com, Eurostat, Statistics Canada, Yahoo! Finance, stocksandnews.com, marketwatch.com, wantchinatimes.com, BBC, 361capital.com, pensionpartners.com, cnbc.com, FactSet.) Securities offered through Registered Representatives of Cambridge Investment Research Inc., a broker-dealer, member FINRA/SIPC. Advisory Services offered through Cambridge Investment Research Advisors, a Registered Investment Adviser. Strategic Investment Partners and Cambridge are not affiliated. Indices mentioned are unmanaged and cannot be invested into directly. Past performance is no guarantee of future results.