
12-31-2018 Weekly Market Update
The very Big Picture:
In the “decades” timeframe, the current Secular Bull Market could turn out to be among the shorter Secular Bull markets on record. This is because of the long-term valuation of the market which, after nine years, has reached the upper end of its normal range.
The long-term valuation of the market is commonly measured by the Cyclically Adjusted Price to Earnings ratio, or “CAPE”, which smooths out shorter-term earnings swings in order to get a longer-term assessment of market valuation. A CAPE level of 30 is considered to be the upper end of the normal range, and the level at which further PE-ratio expansion comes to a halt (meaning that increases in market prices only occur in a general response to earnings increases, instead of rising “just because”).
Of course, a “mania” could come along and drive prices higher – much higher, even – and for some years to come. Manias occur when valuation no longer seems to matter, and caution is thrown completely to the wind as buyers rush in to buy first and ask questions later. Two manias in the last century – the 1920’s “Roaring Twenties” and the 1990’s “Tech Bubble” – show that the sky is the limit when common sense is overcome by a blind desire to buy. But, of course, the piper must be paid and the following decade or two are spent in Secular Bear Markets, giving most or all of the mania gains back.
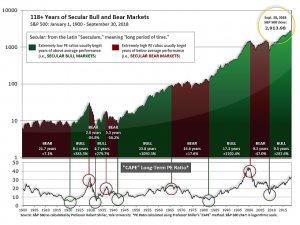
See Fig. 1 for the 100-year view of Secular Bulls and Bears. The CAPE is now at 27.51, up from the prior week’s 26.75, about the level reached at the pre-crash high in October, 2007. Since 1881, the average annual return for all ten year periods that began with a CAPE around this level have been in the 0% – 3%/yr. range. (see Fig. 2).

In the big picture:
The “big picture” is the months-to-years timeframe – the timeframe in which Cyclical Bulls and Bears operate. The U.S. Bull-Bear Indicator (see Fig. 3) is in Cyclical Bull territory at 46.09, down from the prior week’s 47.04.

In the intermediate and Shorter-term picture:
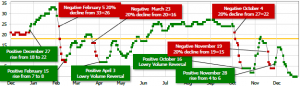
The Shorter-term (weeks to months) Indicator (see Fig. 4) turned positive on November 28th. The indicator ended the week at 0, down from the prior week’s 1. Separately, the Intermediate-term Quarterly Trend Indicator – based on domestic and international stock trend status at the start of each quarter – was positive entering October, indicating positive prospects for equities in the fourth quarter of 2018.
Timeframe summary:
In the Secular (years to decades) timeframe (Figs. 1 & 2), the long-term valuation of the market is simply too high to sustain rip-roaring multi-year returns. The Bull-Bear Indicator (months to years) remains barely positive (Fig. 3), indicating a potential uptrend in the longer timeframe. In the intermediate timeframe, the Quarterly Trend Indicator (months to quarters) is positive for Q4, and the shorter (weeks to months) timeframe (Fig. 4) is positive. Therefore, with three indicators positive and none negative, the U.S. equity markets are rated as Positive.
In the markets:
U.S. Markets: U.S. stocks closed out the week with gains forged in another week of wild volatility. Sharp declines in the beginning of the week pushed the large cap S&P 500 index into bear market territory (down 20% from recent highs), but were followed by sharp rallies later in the week. The Dow swung by 1,186 points on Wednesday and recorded its first one-day 1000-point gain in history. The Dow Jones Industrial Average rebounded 2.7% for the week, ending at 23,062. The technology-heavy NASDAQ Composite retraced roughly half of last week’s plunge, gaining 4% and closing at 6,584. By market cap, the large cap S&P 500 rose 2.9%, while the mid cap S&P 400 added 2.2%, and the small cap Russell 2000 gained 3.5%.
International Markets: Canada’s TSX rose 2.1% and the United Kingdom’s FTSE edged up 0.2%. But on Europe’s mainland, major markets finished the week down albeit modestly. France’s CAC 40 slipped -0.3%, Germany’s DAX finished down ‑0.7%, and Italy’s Milan FTSE fell -0.4%. In Asia, China’s Shanghai Composite finished down -0.9% along with Japan’s Nikkei which fell -0.8%. As grouped by Morgan Stanley Capital International, developed markets rose 2% while emerging markets added 1.9%.
Commodities: Precious metals continued to benefit from the market volatility. Gold rose $24.90 an ounce finishing the week at $1283.00, a gain of 2%. Similarly, Silver surged almost 5% and finished the week at $15.44 an ounce. The industrial metal copper, viewed by analysts as a gauge of global market health due to its wide variety of uses, rose 0.3% last week. Crude oil finished the week down -0.6% to $45.33 per barrel of West Texas Intermediate.
U.S. Economic News: The labor market remained strong the week before Christmas as the number of Americans seeking new unemployment benefits fell slightly. The Labor Department reported initial jobless claims fell by a thousand to 216,000, remaining near their lowest levels in 50 years. Economists had expected claims to remain at 217,000. Claims tend to be volatile this time of year, so many analysts turn to the more stable monthly average of new claims which fell by 4,750 to 218,000. Continuing claims, which counts the number of people already receiving benefits, declined by 4,000 to 1.7 million. That number is also near a 45-year low. Analysts note that the labor market remains strong more than 9 ½ years after the last recession. There remains no sign of the labor market slowing down. Thomas Simons, senior money market economist at Jeffries LLC, noted, “Given the size of the labor force and the typical pace of employment churning, it is unlikely that claims go much lower, outside of seasonal effects that generate one-off dips.”
Higher interest rates appear to be weighing on the housing market as home prices moderate. The latest report from S&P/Case-Shiller showed that home prices were up a seasonally-adjusted 0.4% in October, but the annual increase was its lowest in two years. Year-over-year, prices advanced 5%, down 0.2% from September’s year-over-year increase. The report matched consensus expectations. The cities with the biggest monthly declines were the ones that led the way up—Seattle down -1.1%, San Francisco down -0.7%, and Portland down -0.6%. The rate on a 30-year fixed mortgage climbed as high as 4.94% last month, a significant increase over the 3.5% rate at the beginning of last year, but has more recently pulled back to the 4.6% level.
The National Association of Realtors (NAR) reported the number of contracts to buy previously owned homes fell unexpectedly last month, another sign of weakness in the U.S. housing market. The NAR’s pending home sales index declined -0.7% from October to 101.4. Economists had forecast a 0.7% rise. Pending home sales count the number of home sales in which a contract has been signed but not yet closed. Compared to the same time last year, pending home sales were down -7.7% – the eleventh consecutive year-over-year decline. Lawrence Yun, the NAR’s chief economist, said in a statement on Friday that the pending home sales data was not yet reflecting recent favorable mortgage rate conditions.
Confidence among the nation’s consumers fell for the second month in a row, hitting its lowest level since last summer and 10 points below its peak hit in October. The Conference Board reported its Consumer Confidence index dropped 8.3 points to 128.1 this month, missing forecasts for a reading of 133.3. The recent weakness on Wall Street, along with a pullback in government stimulus and rising interest rates appear to be the culprits. The measure of how Americans view the economy right now, the present situation index, slipped modestly to 171.6 from 172.7. However, the bigger worry is about next year. The future expectations index plunged to 99.1 from 112.3—its lowest reading in more than two years.
An improvement in nationwide industrial production helped offset slight weakening in an otherwise strong labor market, according to the Chicago Federal Reserve. The Chicago Fed’s National Activity Index registered a positive 0.22 last month, up from a neutral reading in October. The smoothed three-month average of the index decreased 0.15 point to 0.06. The index is a weighted average of 85 economic indicators designed so that zero represents trend growth and a three-month average above 0.7 suggests an increasing likelihood of inflation. In November, 48 of the 85 indicators made positive contributions, while 37 detracted. Of note, the indicators that measure manufacturing and production activity contributed a positive 0.08, up from -0.09 a month earlier, while employment-related indicators weakened to 0.10, down -0.05.
A survey of business conditions in the Chicago/Upper Midwest region showed that growth remained strong going into the end of 2018. The Institute for Supply Management’s MNI Chicago Business Barometer downticked a point to 65.4 this month but remained near recent highs. The reading easily beat Wall Street expectations for a reading of 62.4. Readings over 50 indicate an improving economy and numbers over 60 are considered exceptional. In the details of the report, companies continued production of goods and services at a rapid pace and back orders remained at a high level suggesting there has been little deterioration in customer demand. Jai Lakhani, economist at MNI Indicators, stated, “Encouragingly, inflationary pressures subsided for a fifth consecutive month and should this continue, it will ease the burden on firms‘ productive capacities.”
International Economic News: Canadians are in a pessimistic mood when it comes to expectations for next year, a recent poll found. According to a Nanos survey for The Globe and Mail newspaper, more than half of Canadians think the economy will “worsen” or “somewhat worsen” over the next year. That outlook isn’t unexpected as Canada has been hit particularly hard by dropping oil prices. In addition, recent stock market weakness, trade uncertainty and expected higher interest rates also weigh on sentiment. The Nanos survey also asked respondents to choose whether they would prefer that any new revenues in the 2019 budget be used to pay down the deficit or lower corporate taxes. Paying down the deficit was chosen by 85% of respondents, while only 10% chose lower corporate taxes. Mr. Nanos stated, “I think for many Canadians, although they generally support periodic deficits, it’s not necessarily a carte blanche to have deficits over and over and over again.”
The Britain’s Centre for Economics and Business Research (CEBR) stated it expects the United Kingdom to surpass France and become the 6th biggest economy in the world in 2020, surprising those observers who expect dire Brexit consequences. The report predicted that Britain’s GDP will top France’s in the 2020’s even if Scotland votes for independence (as it accounts for a mere 7.7% of overall British GDP). The report predicts that chronic uncertainty regarding Brexit will see the UK fall below both France and India to 7th in the world next year, but it will bounce back to 6th from 2020 onwards “as the economy takes advantage of the new opportunities emerging from Brexit”. The report emphasized that the UK is the leading center in the creative and digital sectors and remains the main financial sector in the European time zone. Meanwhile, France is burdened with high debt, high taxes, and a “rigid” labor market.
For a seventh week, France’s “Yellow Vest” protestors turned out in cities across the country to protest France’s rising cost of living and lack of purchasing power. However, as French police step up their efforts to contain the protests the number of protestors has begun to decline. This week, French television showed hundreds of protestors gathering outside the offices of a number of TV stations in southwest Paris as protestors accuse France’s leading media of favoring President Macron’s government while minimizing the impact of their protests. While the protests were initially sparked by a sharp rise in fuel taxes, the movement quickly spread to encompass broad anger over Macron’s economic policies.
In a survey conducted by Reuters, the leaders of many of Germany’s industry associations stated they did not anticipate the economy entering into a recession and that most forecasts were predicting a solid growth rate of about 1.5% for next year. However, the industry associations did state the government should do more to help companies by lowering corporate taxes and investing more in digital infrastructure. Holger Bingmann, head of the BGA trade group, said Brexit was the “most urgent problem for the German economy” while an escalation of international trade disputes sparked by the United States could potentially derail the economic upswing. Analysts believe the German economy likely grew around 1.5% in 2018 compared with 2.2% in 2017.
China’s economy is set to slow for a seventh consecutive month in December, according to a report from Bloomberg. Bloomberg Economics reported subdued domestic demand and decelerating factory inflation that combined to weigh on growth. Per Bloomberg, the data suggests the government’s stimulus approach and de-escalation of the trade conflict with the U.S. have yet to have much effect on the nation’s growth trajectory. David Qu, economist at Bloomberg Economics, stated the data signals that activity is continuing to slow with uncertainties in global trade and waning confidence still the major constraints.
Factory output in Japan contracted last month and retail sales slowed sharply as pressure rose on the Japanese economy. Industrial output declined 1.1% last month following last month’s 2.9% increase. And while the latest figure was better than expected, Japanese manufacturers now expect further weakness going forward. The Ministry of Economy, Trade, and Industry expect manufacturing output to decline 0.8% in January. Takeshi Minami at Norinchukin Research Institute stated, “Factory output is in the trend towards levelling off. Japan’s export-reliant economy will face a severe situation next year due to the US-China trade frictions and their ripple effects just as global trade growth is decelerating.” Adding to concerns about overseas demand, Japan’s private consumption, which accounts for about 60% of the economy, shows no signs of strength either with recent retail sales data also showing a sharp domestic consumption slowdown.
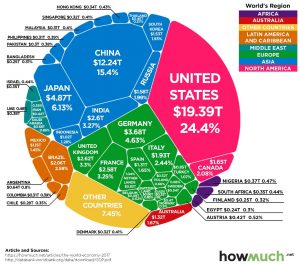
Finally: It is generally known that the United States economy is the world’s largest, with China a distant (but growing) second. But other than that, most people are unaware of how just how big the U.S. economy is relative to the rest of the world. Putting it into perspective for us, researchers at the website howmuch.net created a graphic showing the size of each of the world’s economies relative to each other. Notably, the top four economies – the U.S., China, Japan, and Germany – account for over 50% of the entire world’s economy, while the top 10 make up fully two-thirds of global GDP.
(sources: all index return data from Yahoo Finance; Reuters, Barron’s, Wall St Journal, Bloomberg.com, ft.com, guggenheimpartners.com, zerohedge.com, ritholtz.com, markit.com, financialpost.com, Eurostat, Statistics Canada, Yahoo! Finance, stocksandnews.com, marketwatch.com, wantchinatimes.com, BBC, 361capital.com, pensionpartners.com, cnbc.com, FactSet) These are the opinions of WE Sherman and Co and not necessarily those of Cambridge, are for informational purposes only, and should not be construed or acted upon as individualized investment advice.
Securities offered through Registered Representatives of Cambridge Investment Research Inc., a broker-dealer, member FINRA/SIPC. Advisory Services offered through Cambridge Investment Research Advisors, a Registered Investment Adviser. Strategic Investment Partners and Cambridge are not affiliated.
Indices mentioned are unmanaged and cannot be invested into directly. Past performance is no guarantee of future results. All Investing involves risk. Depending on the types of investments, there may be varying degrees of risk. Investors should be prepared to bear loss, including total loss of principal.