
12-24-18 Weekly Market Update
The very big picture:
In the “decades” timeframe, the current Secular Bull Market could turn out to be among the shorter Secular Bull markets on record. This is because of the long-term valuation of the market which, after nine years, has reached the upper end of its normal range.
The long-term valuation of the market is commonly measured by the Cyclically Adjusted Price to Earnings ratio, or “CAPE”, which smooths out shorter-term earnings swings in order to get a longer-term assessment of market valuation. A CAPE level of 30 is considered to be the upper end of the normal range, and the level at which further PE-ratio expansion comes to a halt (meaning that increases in market prices only occur in a general response to earnings increases, instead of rising “just because”).
Of course, a “mania” could come along and drive prices higher – much higher, even – and for some years to come. Manias occur when valuation no longer seems to matter, and caution is thrown completely to the wind as buyers rush in to buy first and ask questions later. Two manias in the last century – the 1920’s “Roaring Twenties” and the 1990’s “Tech Bubble” – show that the sky is the limit when common sense is overcome by a blind desire to buy. But, of course, the piper must be paid and the following decade or two are spent in Secular Bear Markets, giving most or all of the mania gains back.
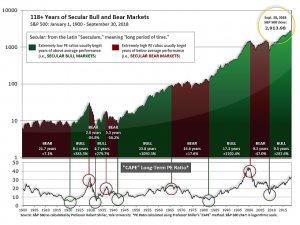
See Fig. 1 for the 100-year view of Secular Bulls and Bears. The CAPE is now at 26.75, down from the prior week’s 28.78, about the level reached at the pre-crash high in October, 2007. Since 1881, the average annual return for all ten year periods that began with a CAPE around this level have been in the 0% – 3%/yr. range. (see Fig. 2).

In the big picture:
The “big picture” is the months-to-years timeframe – the timeframe in which Cyclical Bulls and Bears operate. The U.S. Bull-Bear Indicator (see Fig. 3) is in Cyclical Bull territory at 47.04, down from the prior week’s 50.28.

In the intermediate and Shorter-term picture:
The Shorter-term (weeks to months) Indicator (see Fig. 4) turned positive on November 28th. The indicator ended the week at 1, down from the prior week’s 5. Separately, the Intermediate-term Quarterly Trend Indicator – based on domestic and international stock trend status at the start of each quarter – was positive entering October, indicating positive prospects for equities in the fourth quarter of 2018.

Timeframe summary:
In the Secular (years to decades) timeframe (Figs. 1 & 2), the long-term valuation of the market is simply too high to sustain rip-roaring multi-year returns – but the market has entered the low end of the “mania” range, and all bets are off in a mania. The only thing certain in a mania is that it will end badly…someday. The Bull-Bear Indicator (months to years) is positive (Fig. 3), indicating a potential uptrend in the longer timeframe. In the intermediate timeframe, the Quarterly Trend Indicator (months to quarters) is positive for Q4, and the shorter (weeks to months) timeframe (Fig. 4) is positive. Therefore, with three indicators positive and none negative, the U.S. equity markets are rated as Positive.
In the markets:
U.S. Markets: U.S. stocks suffered another week of steep losses bringing all the major benchmarks to their lowest levels in over a year. The technology-heavy NASDAQ Composite fared the worst, joining the small-cap Russell 2000 and mid cap S&P 400 in bear market territory – that is, down more than 20% from recent highs. U.S. indexes caught up to the weakness in the rest of the world in a hurry with this particularly brutal week of trading. The Dow Jones Industrial Average plunged over 1,655 points to end the week at 22,445, a decline of almost 7%. The NASDAQ Composite nose-dived -8.4% to 6,332. By market cap, the S&P 400 mid cap index retreated -7.0%, while the large cap S&P 500 lost -7.1% and the small cap Russell 2000 tied the NASDAQ for worst-of-the-week by also diving -8.4%.
International Markets: Major international markets were also a sea of red. Canada’s TSX ended down a third consecutive week, losing -4.5%. The United Kingdom’s FTSE retraced last week’s gain by losing -1.8%, while France’s CAC 40 and Germany’s DAX gave up -3.3% and -2.1%, respectively. In Asia, China’s Shanghai Composite retreated -3.0% and Japan’s Nikkei dropped -5.7%. As grouped by Morgan Stanley Capital International, developed markets ended the week down -4.8%, while emerging markets finished down -3.3%.
Commodities: The defensive nature of precious metals shone through amid the stock market weakness. Gold rose $16.70, or 1.4%, closing at $1258.10 an ounce. Silver added 0.4%, rising to $14.70 an ounce. Following a brief respite, oil continued its recent plunge. At the beginning of October, crude oil traded over $75 per barrel. At this week’s close, West Texas Intermediate crude oil traded at $45.59, down -11% just this week. Copper, viewed as a barometer of global market health due to its wide variety of industrial uses, ended the week down -3.2%.
U.S. Economic News: The number of Americans seeking new unemployment benefits rose modestly last week after hitting a 3-month low. The Labor Department reported initial jobless claims rose 8,000 to 214,000. Economists had expected a rise to 218,000. The number of claims remains far below the eight-month high of 235,000 hit a few weeks ago. The four-week average of claims, smoothed to iron-out the weekly volatility, fell 2,750 to 222,000. That number remains near its lowest level since 1973.
Sales of existing homes increased a second month in November according to the National Association of Realtors (NAR). The NAR reported existing home sales ran at a seasonally-adjusted 5.32 million pace last month, easily beating the consensus forecast of a 5.17 million rate. Sales were 1.9% higher than in October, but down 7.0% from the same time last year. In the report, homes were on the market for an average of 42 days, up from 36 days in October. By region, sales surged 7.2% in the Northeast and rose 5.5% in the Midwest. Sales in the South ticked up 2.3%, but the West fell 6.3%. Home prices were up 4.2% from a year ago, hitting a median sales price of $257,700.
Confidence among the nation’s home builders fell to its lowest level since May of 2015 as the housing market has slowed. The National Association of Home Builders’ (NAHB) monthly confidence index fell four points to 56.6 this month. In the details of the NAHB report, the index measuring current sales conditions fell 6 points to 61, while the gauge of sales expectations over the next 6 months dropped 4 points. The index of buyer traffic fell to its lowest level since March of 2016, down 2 points to 43. In its statement, the NAHB blamed rising mortgage rates and high prices for the poor report.
Spending among the nation’s consumers rose 0.4% last month, matching expectations, led by recreational goods and vehicles. Of concern, incomes rose just 0.2%, missing forecasts by 0.1%. Inflation measured by the core Personal Consumption Expenditures reading (rumored to be the Federal Reserve’s preferred inflation gauge) ticked up to a 1.9% annual rate—its highest in three months, but still just below the Fed’s target of 2.0%. Overall, the data points to a strong holiday shopping season, which should translate into a solid fourth-quarter gross domestic product (GDP) reading.
Orders for goods expected to last at least three years, so-called ‘durable goods’, rose less than expected in November. The Commerce Department reported orders rose 0.8%, widely missing expectations of a 1.3% increase. In addition, orders were led by aircraft where just a few orders can strongly affect the headline number. Core business orders, which remove defense and aircraft spending, fell -0.6%, and have been down three of the past four months. Notably, machinery orders fell -1.7%, the first decline in that category since March. Electrical equipment and vehicle orders also fell. Year-over-year, core business orders are down 4.0%, at their slowest pace since March of last year.
Manufacturing activity in the New York region slowed considerably this month, according to the latest data from the New York Federal Reserve. The New York Fed reported its Empire State manufacturing index fell 12.4 points to 10.9, its weakest level in over a year and a half. Economists had expected a reading of 21. There was weakness across the board in the report. The new orders sub-index fell 5.9 points, while the shipments sub-index declined by 7 to 21. Analysts blamed trade tensions with China and a stronger U.S. dollar for the weak report.
In Philadelphia, manufacturing activity remained subdued as the Philly Fed’s General Activity Index fell 3.5 points this month to 9.4—its lowest level since August of 2016. The reading has been down four out of the past five months, as manufacturing growth has continued to moderate. Economists had expected an increase of 2.1 points to 15.0. Below the headline number, shipments rose at their slowest pace since September of 2016. Inventories shrank and new orders and hiring picked up modestly.
Despite the oft-stated wishes of President Trump, the Federal Reserve raised its benchmark interest rate a quarter point to 2.25-2.50%. While there was some good news for market bulls in their announcement – the Federal Reserve now anticipates just two more rate hikes in 2019 instead of the three it had originally planned – the Fed statement reiterated that further rate hikes were expected, a statement that surprised some economists and greatly rattled the stock market. Federal Reserve Chairman Jerome Powell stated “Policy at this point does not need to be accommodative—it can move to neutral.” In a preview of 2019 he said the Fed expects “solid growth next year, declining unemployment and a healthy economy”.
International Economic News: Factory activity has led Canada to its fastest economic growth in five months, according to Statistics Canada. Canada’s gross domestic product grew 0.3% in October led by manufacturing, finance/insurance, and wholesale trade. The reading exceeded analysts’ forecasts of a 0.2% rise. Factory production rebounded 0.7% making up most of its losses over the previous two months, while wholesale trade climbed 1%. This GDP report is the last one Bank of Canada policymakers will see before setting interest rates in early January. After raising rates five times since mid-2017, Governor Stephen Poloz has said whether he will consider another rate increase will depend on fresh data and that he needs to assess the drag from a drop in Alberta oil prices.
Across the Atlantic, the Bank of England cut its growth forecast, stating that uncertainty over the UK’s departure from the EU had “intensified considerably” over the past month. Against a backdrop of weaker global growth, the bank’s Monetary Policy Committee (MPC) voted unanimously to hold interest rates at 0.75%. Furthermore, the bank now expects the economy to grow by just 0.2% in the final quarter of 2018, down from an earlier forecast of 0.3%. Analysts have stated that if there is a deal reached regarding Brexit, the Bank of England will likely raise rates quickly. Samuel Tombs, Chief UK Economist at Pantheon Macroeconomics stated, “We continue to think that the MPC won’t wait for signs of a recovery to emerge in the data and will raise Bank Rate to 1.0% in May.”
French statistics agency INSEE reported French economic growth should rebound early next year after violent anti-government protests and declining business confidence cut short a previously expected year-end recovery. The Eurozone’s second-largest economy is on course to grow only 0.2% in the final quarter of the year, down from 0.4% in the third. INSEE had previously forecast growth of 0.4% in the final quarter, but cut its estimate after a proposed sharp hike in fuel taxes by President Macron sparked widespread and violent protests. But even before the protests, business confidence had been deteriorating as global trade tensions continued to rise.
Worries continue to grow about the strength of Germany, Europe’s economic engine, after a key indicator suggested fears over trade disputes and Brexit are impacting business activity. The Ifo Institute reported its business confidence index dropped 0.9 point to 101.0 in December as managers’ views of both their current circumstances and their prospects for the next six months fell. The reading was the fourth drop in a row and the lowest reading in over two years for the index. Uncertainty over the economy is growing just as the European Central Bank announced that it will end its 2.6 billion euro ($3 billion USD) stimulus program. The ECB says the economy is strong enough to halt the stimulus but is keeping other support measures, such as record-low interest rates in place.
In a policy shift that could help China withstand short-term shocks from its trade conflict with the United States, Chinese President Xi Jinping approved a combination of measures aimed at spurring investment and consumption. They include allowing easier credit (especially to local governments) and expanding tax cuts. The plan comes as China’s economy faces headwinds not just from tariff disputes with the U.S., but also from weakening household spending, declining industrial output, and slumping factory investment. The plan keeps risk control as a major task for 2019. It also promises to use tax cuts on a greater scale and significantly increase the size of bond issuance by local governments, which have long been under Beijing’s scrutiny for running up debt.
Japan’s economy is on track to equal its record postwar expansion streak with a 73rd consecutive month of growth, according to the government’s monthly economic report. If confirmed, the current recovery will officially match the record set in the period from February 2002 to February 2008. Economic and Fiscal Policy Minister Toshimitsu Motegi stated this “appears to be highly likely”. The streak has been driven by a growing global economy which has fueled brisk exports and capital spending over the last several years. The Bank of Japan’s monetary policy put downward pressure on the yen, making Japan’s exports more affordable and bolstering exporters’ profits. The report cited “uncertainty in overseas economies” and “fluctuations in the financial and capital markets” as risk factors.
Finally: Especially after suffering their worst week since 2008, pretty much everyone knows that stocks are struggling of late. But with each of the major indexes falling into bear market territory, many are probably unaware of just how swiftly and severely individual stocks have been hit. Many of Wall Street’s recent favorites are down a ton, with the popular “FAANG” stocks (Facebook, Amazon, Apple, Netflix, and Google) down anywhere from 20% to 40%. Research firm FactSet created the following graphic, showing just how bad the carnage has been – and keep in mind that the losses are through the 20th, and don’t include the further damage done on Friday the 21st:

(sources: all index return data from Yahoo Finance; Reuters, Barron’s, Wall St Journal, Bloomberg.com, ft.com, guggenheimpartners.com, zerohedge.com, ritholtz.com, markit.com, financialpost.com, Eurostat, Statistics Canada, Yahoo! Finance, stocksandnews.com, marketwatch.com, wantchinatimes.com, BBC, 361capital.com, pensionpartners.com, cnbc.com, FactSet) These are the opinions of WE Sherman and Co and not necessarily those of Cambridge, are for informational purposes only, and should not be construed or acted upon as individualized investment advice.
Securities offered through Registered Representatives of Cambridge Investment Research Inc., a broker-dealer, member FINRA/SIPC. Advisory Services offered through Cambridge Investment Research Advisors, a Registered Investment Adviser. Strategic Investment Partners and Cambridge are not affiliated.
Indices mentioned are unmanaged and cannot be invested into directly. Past performance is no guarantee of future results. All Investing involves risk. Depending on the types of investments, there may be varying degrees of risk. Investors should be prepared to bear loss, including total loss of principal.