
12/30/19 Weekly Market Update
The very Big Picture:
The long-term valuation of the market is commonly measured by the Cyclically Adjusted Price to Earnings ratio, or “CAPE”, which smooths out shorter-term earnings swings in order to get a longer-term assessment of market valuation. A CAPE level of 30 is considered to be the upper end of the normal range, and the level at which further PE-ratio expansion comes to a halt (meaning that increases in market prices only occur in a general response to earnings increases, instead of rising “just because”). The market is currently at that level.
Of course, a “mania” could come along and drive prices higher – much higher, even – and for some years to come. Manias occur when valuation no longer seems to matter, and caution is thrown completely to the wind as buyers rush in to buy first and ask questions later. Two manias in the last century – the 1920’s “Roaring Twenties” and the 1990’s “Tech Bubble” – show that the sky is the limit when common sense is overcome by a blind desire to buy. But, of course, the piper must be paid and the following decade or two are spent in Secular Bear Markets, giving most or all of the mania gains back.
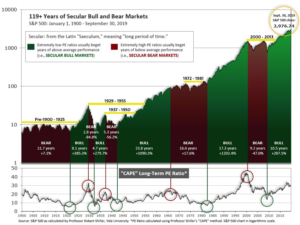
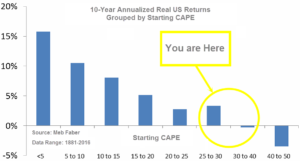
See Fig. 1 for the 100-year view of Secular Bulls and Bears. The CAPE is now at 31.06, up from the prior week’s 30.88, above the level reached at the pre-crash high in October, 2007. Since 1881, the average annual return for all ten year periods that began with a CAPE around this level have been in the 0% – 3%/yr. range. (see Fig. 2).
In the Big Picture:
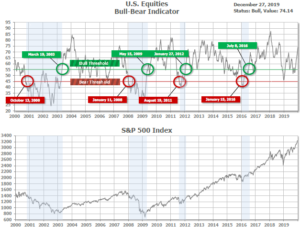
The “big picture” is the months-to-years timeframe – the timeframe in which Cyclical Bulls and Bears operate. The U.S. Bull-Bear Indicator (see Fig. 3) is in Cyclical Bull territory at 74.14, up from the prior week’s 72.17.
In the Intermediate and Shorter-term Picture:
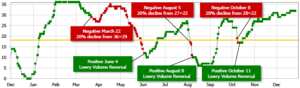
The Shorter-term (weeks to months) Indicator (see Fig. 4) is positive. The indicator ended the week at 32, unchanged from the prior week. Separately, the Intermediate-term Quarterly Trend Indicator – based on domestic and international stock trend status at the start of each quarter – was positive entering October, indicating positive prospects for equities in the fourth quarter of 2019.
Timeframe Summary:
In the Secular (years to decades) timeframe (Figs. 1 & 2), the long-term valuation of the market is historically too high to sustain rip-roaring multi-year returns. The Bull-Bear Indicator (months to years) remains positive (Fig. 3), indicating a potential uptrend in the longer timeframe. In the intermediate timeframe, the Quarterly Trend Indicator (months to quarters) is positive for Q4, and the shorter (weeks to months) timeframe (Fig. 4) is positive. Therefore, with three indicators positive and none negative, the U.S. equity markets are rated as Positive.
In the Markets:
U.S. Markets: Continued trade optimism helped lift U.S. stocks to new highs during the holiday-shortened week. The technology-heavy NASDAQ Composite outperformed the other major benchmarks and crossed the 9000 level for the first time. Smaller cap benchmarks lagged with small losses. The Dow Jones Industrial Average rose 190 points to close at 28,645, a gain of 0.7%, while the NASDAQ added 0.9%. The large cap S&P 500 had its fifth consecutive week of gains, adding 0.6%, while the mid cap S&P 400 index gave up -0.1% and the small cap Russell 2000 declined -0.2%.
International Markets: Canada’s TSX rose 0.3%, while the United Kingdom’s FTSE 100 gained 0.8%. On Europe’s mainland, France’s CAC 40 added 0.3%, Germany’s DAX rose 0.1%, and Italy’s Milan FTSE fell -1%. In Asia, China’s Shanghai Composite ended the week flat, and Japan’s Nikkei ticked up 0.1%. As grouped by Morgan Stanley Capital International, developed markets finished the week up 0.7%, while emerging markets rose over 1%.
Commodities: Precious metals rallied last week along with equities. Gold rose back to near recent highs, rising 2.5% to $1518.10 an ounce, while silver surged 4.2% to $17.94 an ounce. Oil notched its fourth consecutive week of gains by adding 2.1% to close at $61.72 per barrel of West Texas Intermediate crude. The industrial metal copper ended the week up for a sixth consecutive week, adding 0.84%. Analysts view copper as proxy for global economic health due to its wide variety of uses.
U.S. Economic News: The number of Americans claiming first-time unemployment benefits fell for a second consecutive week last week. The Labor Department reported that initial jobless claims fell by 13,000 to a seasonally-adjusted 222,000 in the week ended December 21. Meanwhile, the less-volatile monthly average of new claims rose by 2,250 to 228,000. Claims have remained below the key 300,000 level that analysts use to indicate a “healthy” jobs market. Continuing claims, which counts the number of people already collecting unemployment benefits, decreased by 6,000 to 1.72 million. That number is reported with a one-week delay.
Sales of newly-constructed homes increased 1.3% in November to a seasonally-adjusted annual rate of 719,000, but were well below economists’ forecasts of 740,000. Still, new-home sales were 19.4% higher than the same time last year. In the details, the median sales price for new homes was $330,800 and the government estimated there was a 5.4 month supply of new homes available on the market. Economists generally consider a six-month supply of homes a “balanced” housing market. The supply of new homes last peaked at the 7-month level back in December 2018. By region, new home sales increased in the Northeast and the West, while sales volume dropped in the South. The Midwest remained flat.
Orders for goods expected to last at least three years, so-called “durable goods”, declined last month after a slight uptick in October, according to the Commerce Department. The entirety of the overall decline was due to a 72.7% plunge in orders for defense aircraft and parts. Stripping out defense goods, orders were actually up 0.8%. Core capital goods orders, which strip out both defense and aircraft orders, were a bright spot posting their second straight monthly gain. Paul Ashworth, chief U.S. economist at Capital Economics observed “It’s not a disaster, but business equipment investment was still close to stagnant.”
The Chicago Federal Reserve reported its National Activity Index surged to 0.56 in November 2019, up from a downwardly revised -0.76 the previous month. Economists had expected a reading of -0.09. The reading hit its highest level since February 2018 as production-related indicators contributed 0.49 point, up from -0.6 in October. Furthermore, employment-related indicators contributed 0.12, up from -0.07. In the details of the report, fifty of the 85 individual indicators made positive contributions, while 35 were negative.
International Economic News: Statistics Canada reported Canada’s economy contracted slightly in October, with real gross domestic product down -0.1% from September. It was the first month-to-month decline since February. Despite the recent flurry of individual reports that indicated significant slowing in some sectors, economists had projected a flat GDP reading for October. Of note, Canada had its biggest month-to-month decline in retail sales since March 2016, as well as significant declines in wholesale sales and manufacturing. CIBC Chief Economist Avery Shenfeld wrote in a note to clients, “Markets and the Bank of Canada have been tempted to sound the ‘all clear’ signal . . . but a 0.1 per cent decline in October GDP puts the economy on a chilly path at the start of the fourth quarter.”
UK Prime Minister Boris Johnson’s government is drawing up new public spending rules that would pull investment away from the affluent south-east of England and send it to less prosperous parts of the UK. Under the plan, government investment decisions in areas such as infrastructure and government-funded research and development would be focused on improving the well-being of people living in poorer areas and narrowing the wealth and productivity gaps between regions. The proposed changes to Treasury spending rules could give the government the opportunity to funnel more investment into northern England, the Midlands and Wales after the Conservatives seized many constituencies in these parts of the UK from the Labour party in the general election.
Normally crowded restaurants and department stores are eerily quiet in France’s capital as rail and subway strikes enter the third week. In Paris and other cities where protests have brought half a million demonstrators into the streets, consumer spending is down significantly. Restaurants and retailers face staff shortages as employees spend hours trying to get to work, if they can make it at all. Lawyers, police officers, and hospital workers joined protestors this week to oppose President Emmanuel Macron’s plan to simplify the country’s complex national pension system—generally considered one of the most generous in the world. French Finance Minister Bruno Le Maire has insisted that the harm to France’s economy would be limited, since the strikes are mainly hitting cities that depend on public transportation, not the whole country. Le Maire said, “Our historical experience is that these movements ultimately weigh little on the growth of the economy.”
In Germany, a recent survey of representatives of major business revealed that they expect next year to be another weak year for the economy. Dieter Kempf, president of the Federation of German Industries, said the “government has to make an effort for more investments”. Furthermore, Mr. Kempf admitted, “No bottoming is in sight yet. Exports are also stagnating.” After years of booming, Germany’s economy is likely to have grown by only 0.5% in 2019, analysts say. Politicians in Berlin hope the end of Brexit uncertainty will help the economy get back on track.
China’s ‘Beige Book’ (a report based on a survey of more than 3,300 Chinese businesses) showed fourth-quarter economic growth may have been the weakest of 2019. However, the economy still showed improvement compared to the previous quarter and the same period last year. Analysts say three important results emerged from the survey. First, there are signs that cash flows have deteriorated quickly. The report stated fourth quarter late payables and deliverables soared “to the worst levels we’ve recorded.” Second, new orders continue to fall even though companies are reporting higher revenue in the fourth quarter. Finally, the economy saw record levels of corporate borrowing. “Loan applications nationally shot to an all-time high, while rejections sank to an all-time low,” the report states.
Japan’s industrial output slipped for a second consecutive month in November, raising the likelihood that the economy will show contraction in the fourth quarter. Data showed factory output fell -0.9% from the previous month, a slower decline than the -1.4% fall economists had forecast. The reading followed a downwardly revised ‑4.5% plunge the previous month. Last month’s reading was the largest month-to-month decline since the government started compiling the data in January 2013. Nonetheless, there is a tone of optimism in a survey by Japan’s Ministry of Economy, Trade and Industry: manufacturers expect output to gain 2.8% in December, and 2.5% in January.
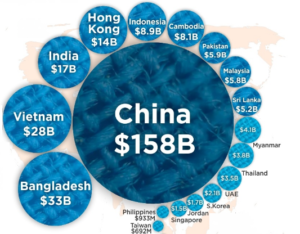
Finally: Did you get any articles of clothing for Christmas? It’s likely you did, along with many millions of other gift recipients. Unless it was very high-end (think Italian or French), it was almost certainly made in Asia…and more specifically, in China. China’s huge clothing export business is bigger than the other fifteen billion-dollar-or-more Asian exporters – combined! The graphic below, from howmuch.net based on World Trade Organization data, shows just how mind-bogglingly large the Chinese clothing export business has become.
(Sources: all index return data from Yahoo Finance; Reuters, Barron’s, Wall St Journal, Bloomberg.com, ft.com, guggenheimpartners.com, zerohedge.com, ritholtz.com, markit.com, financialpost.com, Eurostat, Statistics Canada, Yahoo! Finance, stocksandnews.com, marketwatch.com, wantchinatimes.com, BBC, 361capital.com, pensionpartners.com, cnbc.com, FactSet) Securities offered through Registered Representatives of Cambridge Investment Research Inc., a broker-dealer, member FINRA/SIPC. Advisory Services offered through Cambridge Investment Research Advisors, a Registered Investment Adviser. Strategic Investment Partners and Cambridge are not affiliated.
Indices mentioned are unmanaged and cannot be invested into directly. Past performance is no guarantee of future results. All Investing involves risk. Depending on the types of investments, there may be varying degrees of risk. Investors should be prepared to bear loss, including total loss of principal.