
1-6-20 Weekly Market Update
The very Big Picture:
The long-term valuation of the market is commonly measured by the Cyclically Adjusted Price to Earnings ratio, or “CAPE”, which smooths out shorter-term earnings swings in order to get a longer-term assessment of market valuation. A CAPE level of 30 is considered to be the upper end of the normal range, and the level at which further PE-ratio expansion comes to a halt (meaning that increases in market prices only occur in a general response to earnings increases, instead of rising “just because”). The market is currently at that level.
Of course, a “mania” could come along and drive prices higher – much higher, even – and for some years to come. Manias occur when valuation no longer seems to matter, and caution is thrown completely to the wind as buyers rush in to buy first and ask questions later. Two manias in the last century – the 1920’s “Roaring Twenties” and the 1990’s “Tech Bubble” – show that the sky is the limit when common sense is overcome by a blind desire to buy. But, of course, the piper must be paid and the following decade or two are spent in Secular Bear Markets, giving most or all of the mania gains back.
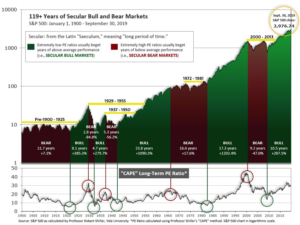
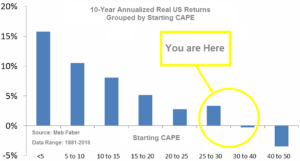
See Fig. 1 for the 100-year view of Secular Bulls and Bears. The CAPE is now at 31.02, down slightly from the prior week’s 31.06, above the level reached at the pre-crash high in October, 2007. Since 1881, the average annual return for all ten year periods that began with a CAPE around this level have been in the 0% – 3%/yr. range. (see Fig. 2).
In the Big Picture:
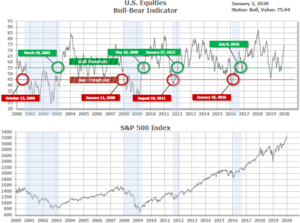
The “big picture” is the months-to-years timeframe – the timeframe in which Cyclical Bulls and Bears operate. The U.S. Bull-Bear Indicator (see Fig. 3) is in Cyclical Bull territory at 75.04, up from the prior week’s 74.14.
In the Intermediate and Shorter-term Picture:
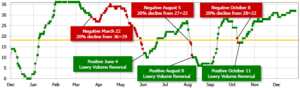
The Shorter-term (weeks to months) Indicator (see Fig. 4) is positive. The indicator ended the week at 32, unchanged from the prior week. Separately, the Intermediate-term Quarterly Trend Indicator – based on domestic and international stock trend status at the start of each quarter – was positive entering October, indicating positive prospects for equities in the fourth quarter of 2019.
Timeframe Summary:
In the Secular (years to decades) timeframe (Figs. 1 & 2), the long-term valuation of the market is historically too high to sustain rip-roaring multi-year returns. The Bull-Bear Indicator (months to years) remains positive (Fig. 3), indicating a potential uptrend in the longer timeframe. In the intermediate timeframe, the Quarterly Trend Indicator (months to quarters) is positive for Q1, and the shorter (weeks to months) timeframe (Fig. 4) is positive. Therefore, with three indicators positive and none negative, the U.S. equity markets are rated as Positive.
In the Markets:
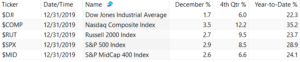
U.S. Markets: U.S. stocks ended the holiday-shortened week mixed after global markets pulled back on the news of the U.S. attack on Iranian military leaders the previous evening. The technology-heavy NASDAQ Composite fared the best, while the smaller-cap indexes underperformed. The Dow Jones Industrial Average ended the week down just 10 points finishing the week at 28,634. The NASDAQ was the only major index to finish in the green, adding 0.2%. The large cap S&P 500 gave up -0.2%, while the mid cap S&P 400 and small cap Russell 2000 declined -0.4% and -0.5%.
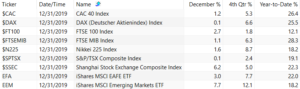
International Markets: Global markets were mixed last week with Canada’s TSX and the United Kingdom’s FTSE off -0.6% and -0.3%, respectively, while France’s CAC 40 gained 0.1%. Germany’s DAX finished down -0.9%. In Asia, China’s Shanghai Composite rallied 2.6%, while Japan’s Nikkei finished down -0.8%. As grouped by Morgan Stanley Capital International, developed markets gave up -0.5% and emerging markets retreated -0.3%.
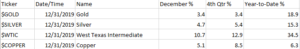
Commodities: Precious metals surged on the news of violence in the Mideast. Gold surged $34.30 to $1552.40 an ounce, a gain of 2.3%. Silver also rose, closing at $18.15 an ounce, a gain of 1.2%. Not surprisingly, crude oil had a fifth week of gains. West Texas Intermediate crude finished the week at $63.05 a barrel, a gain of 2.2%. But the industrial metal copper, viewed by some as a barometer of global economic health due to its wide variety of uses, finished the week down -1.5%.
December, 4th Quarter and 2018 Major Markets Summaries:
Domestic:
International:
Commodities:
U.S. Economic News: The number of Americans who applied for first time unemployment benefits fell slightly, finishing the year back at a near 50-year low. The Labor Department reported that initial jobless claims slipped by 2,000 to 222,000 last week. Economists had expected a reading of 223,000. The monthly average of new claims, smoothed to iron out the weekly volatility, rose by 4,750 to 233,250. The number of people already collecting unemployment benefits, known as continuing claims, increased by 5,000 to 1.73 million. With unemployment near a 50-year low and wages rising, Americans continue to spend enough to prolong a record economic expansion now in its 11th year.
The National Association of Realtors (NAR) reported their index of pending home sales increased 1.2% in November from the previous month. The index records the number of transactions in which a contract has been signed, but not yet closed. Analysts use the data for an early read of likely sales activity in coming months. Compared with the same time last year, contract signings were up 7.4%. By region, sales in the West increased 5.5%, while sales in the Midwest rose by 1%. The Northeast and South saw only fractional changes. Compared to the same time last year, sales were up in all four regions. Lawrence Yun, chief NAR economist noted in the release that a lack of inventory of homes for sale will remain a challenge. However, he added, “favorable conditions are expected throughout 2020 as well.”
As mortgage rates held steady at low levels, home-price growth accelerated in October according to the latest data from S&P CoreLogic Case-Shiller. Case-Shiller’s 20-city home price index rose 2.2% in October, compared to the same time last year. Month-over-month, the index ticked up 0.1%. At a national level, home prices were up an annualized 3.3%–an increase from September’s reading. In the report, Phoenix saw the highest home-price appreciation in the country in October, up 5.8% year-over-year. Tampa was next with a 4.9% increase, followed by Charlotte, North Carolina up 4.8%. Of note, San Francisco experienced its third consecutive decline in home prices on an annual basis.
Americans felt more confident in the health of the U.S. economy at the end of the year, but not quite as optimistic as they were last summer, according to the latest survey. The Conference Board reported its index of consumer confidence fell slightly to 126.5 in December. Economists had expected a reading of 130.2. By historical standards, consumer confidence still remains quite high. The index hit an 18-year high of 137.9 in October 2018 and has remained near that level since. In the details, the measure of how consumers feel about the economy right now rose 4.4 points, however the index that tracks how Americans view the next six months declined. That prompted Lynn Franco, director of economics at the Conference Board to state, “While the economy hasn’t shown signs of further weakening, there is little to suggest that growth, and in particular consumer spending, will gain momentum in early 2020.”
Manufacturing in the U.S. contracted for a fifth consecutive month as America’s trade dispute with China continued. The Institute for Supply Management (ISM) reported its manufacturing index slid 0.9 point to 47.2 in December—its weakest reading in ten years. While the manufacturing sector continued to remain under pressure tied to the ongoing trade war with China, December’s deterioration appeared to be primarily due to Boeing’s suspension of production of its troubled 737 Max jetliner. Economists had expected the index would be 48.8. Only three of the eighteen industries tracked by ISM reported their businesses expanded in December—the fewest since 2009. Readings below 50 indicate contraction.
The economy in the region around the Windy City improved in December for the second month in a row. However, analysts pointed out that the region is still suffering from the trade dispute with China that’s weighed on farmers and manufacturers. The Chicago Purchasing Managers’ Index (PMI) rose 2.7 points to 48.9, better than Wall Street had expected. However, as readings below 50 indicate contraction, the index showed the economy in the Greater Chicago area is still contracting. In the details, new orders and employment fell at a faster pace compared to the previous month, but those numbers were mostly offset by improved production numbers.
International Economic News: Canada is once again one of the world’s 10 largest economies, according to the latest edition of the World Economic League Table. The table places Canada as the world’s 10th largest economy based on its GDP of U.S. $1.731 trillion in 2019. South Korea had edged out Canada into the top 10, but fell back to 11th place this year due to ripple effects from the U.S.-China trade dispute and the slowdown in the Chinese economy. The Center for Economics and Business Research, which publishes the annual table, stated immigration played a big part in Canada’s economic strength. “Countries that are successful in attracting skilled migrants tend to grow faster,” reads a press release accompanying the report.
Across the Atlantic, the British Chamber of Commerce’s quarterly economic survey of 6500 firms across the country showed the United Kingdom’s economy ended the year in stagnation. In the report, the service sector, which accounts for almost 80% of economic output, worsened in the final quarter of the year. Furthermore, indicators for factories’ export and domestic orders were negative for two consecutive quarters for the first time in a decade. Manufacturers’ investment plans hit an eight-year low. Suren Thiru, the BCC’s head of economics, said: “The UK economy limped through the final quarter of 2019.
On Europe’s mainland, French President Emmanuel Macron is under pressure to work out a compromise with trade unions as the country endured its longest protests in thirty years. Public sector strikes entered their 30th day on Friday. Furthermore, the latest dispute doesn’t seem to have an end in sight with trade unions recently criticizing Macron as “living in his own bubble”. “The process will be protracted, strikes could last for another month,” Tomasz Michalski, professor of economics at HEC Paris business school stated. There will be a new round of talks between government officials and trade unionists this coming week as workers are set to take to the streets again. During his new years’ address, President Macron asked for a “rapid compromise” between his government and workers.
The weakness in Germany’s manufacturing sector has spilled over into its labor market as unemployment rose more than expected in December. Data from Germany’s Federal Labor Office showed the number of people out of work rose by 8,000 to 2.279 million in seasonally-adjusted terms. The reading greatly exceeded forecasts for a rise of 2,000. With a jobless rate of 5%, Labor Office head Detlef Scheele stated, “The weak economic cycle is leaving visible marks (on the labor market).”
In Asia, China’s central bank set the tone for its policy going into the new year with a reserve cut to aid credit markets. The People’s Bank of China (PBOC) trimmed the amount of cash that lenders must hold in reserve, and signaled that it would continue action in 2020 to reduce borrowing costs for companies. The required reserve ratio for commercial lenders will be lowered by 50 basis points next week, releasing about 800 billion yuan ($115 billion) of liquidity into the financial system. The cut aims to help banks reduce their lending rate to businesses, the PBOC said in a separate statement. Li-Gang Liu, economist at Citigroup Inc. wrote in a note, ““We expect the PBOC to keep an easing bias by maintaining a measured pace in the rate cut cycle…Accommodative monetary policy would support domestic demand, particularly fixed-asset investment.”
Major Japanese firms are becoming more pessimistic about the economy due to concerns over prolonged U.S.‑China trade tensions and about last year’s consumption tax hike, a recent survey showed. Of over 100 companies polled, 19% said Japan’s growth was gradually expanding (down from 23% in last summer’s survey), while none said the economy was growing strongly. The largest group, 61%, said the economy was flat, and 19% saw it in a gradual recession. For the coming year, 43% of companies said they expect the economy to expand, helped by Tokyo’s hosting of the Olympics in the summer.
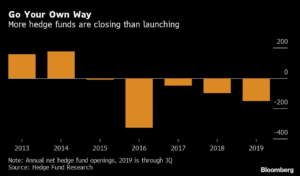
Finally: While most investors are likely celebrating gains in the stock market last year, those generally considered to be the top market professionals had less than lackluster returns. According to data from research firm Eurekahedge, hedge funds returned just 6.96% on average in 2019—far below the 22.3% gain for the Dow and 28.9% gain for the S&P 500. Underperformance by hedge funds has been the rule rather than the exception for most of the years since the Great Recession. Well-known hedge fund manager David Tepper – a frequent guest on CNBC and often quoted in the press – announced he was returning all outside money to his investors and hereafter only managing his own funds. Investors themselves yanked a staggering $59 billion out of hedge funds last year in North America alone as the industry is on track to record more hedge fund closures than new hedge fund launches for a fifth consecutive year. The chart below, from Bloomberg, illustrates the five-year slump.
(Sources: all index return data from Yahoo Finance; Reuters, Barron’s, Wall St Journal, Bloomberg.com, ft.com, guggenheimpartners.com, zerohedge.com, ritholtz.com, markit.com, financialpost.com, Eurostat, Statistics Canada, Yahoo! Finance, stocksandnews.com, marketwatch.com, wantchinatimes.com, BBC, 361capital.com, pensionpartners.com, cnbc.com, FactSet) Securities offered through Registered Representatives of Cambridge Investment Research Inc., a broker-dealer, member FINRA/SIPC. Advisory Services offered through Cambridge Investment Research Advisors, a Registered Investment Adviser. Strategic Investment Partners and Cambridge are not affiliated.
Indices mentioned are unmanaged and cannot be invested into directly. Past performance is no guarantee of future results. All Investing involves risk. Depending on the types of investments, there may be varying degrees of risk. Investors should be prepared to bear loss, including total loss of principal.