
12/23/19 Weekly Market Update
The very Big Picture:
The long-term valuation of the market is commonly measured by the Cyclically Adjusted Price to Earnings ratio, or “CAPE”, which smooths out shorter-term earnings swings in order to get a longer-term assessment of market valuation. A CAPE level of 30 is considered to be the upper end of the normal range, and the level at which further PE-ratio expansion comes to a halt (meaning that increases in market prices only occur in a general response to earnings increases, instead of rising “just because”). The market is currently at that level.
Of course, a “mania” could come along and drive prices higher – much higher, even – and for some years to come. Manias occur when valuation no longer seems to matter, and caution is thrown completely to the wind as buyers rush in to buy first and ask questions later. Two manias in the last century – the 1920’s “Roaring Twenties” and the 1990’s “Tech Bubble” – show that the sky is the limit when common sense is overcome by a blind desire to buy. But, of course, the piper must be paid and the following decade or two are spent in Secular Bear Markets, giving most or all of the mania gains back.
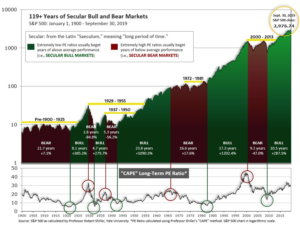
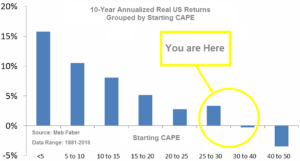
See Fig. 1 for the 100-year view of Secular Bulls and Bears. The CAPE is now at 30.88, up from the prior week’s 30.38, above the level reached at the pre-crash high in October, 2007. Since 1881, the average annual return for all ten year periods that began with a CAPE around this level have been in the 0% – 3%/yr. range. (see Fig. 2).
In the Big Picture:
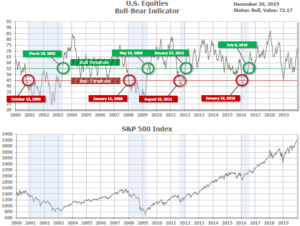
The “big picture” is the months-to-years timeframe – the timeframe in which Cyclical Bulls and Bears operate. The U.S. Bull-Bear Indicator (see Fig. 3) is in Cyclical Bull territory at 72.17, up from the prior week’s 70.12.
In the Intermediate and Shorter-term Picture:
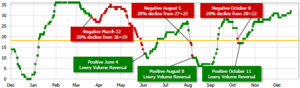
The Shorter-term (weeks to months) Indicator (see Fig. 4) is positive. The indicator ended the week at 32, up from the prior week’s 30. Separately, the Intermediate-term Quarterly Trend Indicator – based on domestic and international stock trend status at the start of each quarter – was positive entering October, indicating positive prospects for equities in the fourth quarter of 2019.
Timeframe Summary:
In the Secular (years to decades) timeframe (Figs. 1 & 2), the long-term valuation of the market is historically too high to sustain rip-roaring multi-year returns. The Bull-Bear Indicator (months to years) remains positive (Fig. 3), indicating a potential uptrend in the longer timeframe. In the intermediate timeframe, the Quarterly Trend Indicator (months to quarters) is positive for Q4, and the shorter (weeks to months) timeframe (Fig. 4) is positive. Therefore, with three indicators positive and none negative, the U.S. equity markets are rated as Positive.
In the Markets:
U.S. Markets: The large cap benchmark S&P 500 index recorded a solid weekly gain as investors appeared to continue celebrating the announcement of a “phase one” trade deal between the U.S. and China. The bigger story among Wall Street denizens was the S&P 400 mid cap index joining large caps and the NASDAQ Composite in record territory, taken as a welcome sign of broadening participation in the rally. The Dow Jones Industrial Average rose 319 points to end the week at 28,455, a gain of 1.1%. The technology-heavy NASDAQ Composite added 2.2%. The large cap S&P 500 added 1.7%, while the mid cap S&P 400 rose 2.0% and small cap Russell 2000 gained 2.1%, respectively.
International Markets: Canada’s TSX rose 0.7%, while the United Kingdom’s FTSE 100 surged 3.1% (defying some predictions of an epic crash should Boris Johnson be elected). On Europe’s mainland France’s CAC 40 added 1.7%, Germany’s DAX gained 0.3%, and Italy’s Milan FTSE rose 2.9%. In Asia, China’s Shanghai Composite gained 1.3%, while Japan’s Nikkei lost ground, giving up -0.9%. As grouped by Morgan Stanley Capital International developed markets rose 0.4%, while emerging markets added 2.6%.
Commodities: Gold consolidated following recent gains, finishing the week down just $0.30 to $1480.90 an ounce. Silver rose for a second week adding 1.3% to $17.22. Oil rose for a third consecutive week. West Texas Intermediate crude adding 0.6% to $60.44 per barrel. The industrial metal copper, viewed by some analysts as a barometer of world economic health due to its variety of uses, had its fifth consecutive week of gains, adding 0.9%. The recession scare, which drove copper prices lower in anticipation of reduced demand, seems to be in the rear-view mirror.
U.S. Economic News: The number of people applying for first-time unemployment benefits fell back last week after spiking to a more than two year high in the previous report. The Labor Department reported initial jobless claims fell by 18,000 to a seasonally-adjusted 234,000, back to near multi-decade lows. Economists had estimated new claims would total 235,000. New claims had jumped to its highest level in more than two years last week as the late Thanksgiving holiday skewed the government’s process for adjusting the numbers for seasonal swings in employment. The less volatile monthly average of new claims rose by 1,500 to 225,000. Continuing claims, which counts the number of people already receiving benefits, increased by 51,000 to 1.72 million.
The number of job openings ticked up in October and more Americans quit their jobs, both signs of a strong labor market according to analysts. The Labor Department’s Job Openings and Labor Turnover Survey (known as JOLTS) reported job openings totaled 7.27 million in October. That’s up from 7.03 million the prior month, but still below the all-time highs set last year. The “quits rate”, rumored to be one of the Federal Reserve’s preferred gauges for the health of the labor market, remained flat at 2.3%. In October, 3.51 million Americans left their jobs, up from the 3.47 million in September. Analysts watch the number of quits as a barometer of the labor market, as it is assumed that one would only quit one’s job if an even more lucrative one was available.
The pace of home-building continued to ramp up in the wake of this summer’s drop in interest rates. Builders began construction on new homes at an annualized rate of 1.37 million, the Commerce Department reported. The reading is a 3.2% increase from October, and 13.6% higher than the same time last year. Furthermore, permit activity hit yet another post-recession high. Building permits for privately-owned housing were issued at a seasonally-adjusted rate of 1.48 million. That reading is 1.4% above October’s number, and 11.1% greater than this time last year. Both readings exceeded consensus estimates. Housing market analysts look at permit activity to give an indication for future building activity.
Sales of existing homes fell by 1.7% last month, but not because of lack of demand, but rather due to the constrained inventory of homes for sale. The National Association of Realtors reported existing home sales occurred at a seasonally-adjusted annual pace of 5.35 million. The reading missed the consensus estimate among economists that the pace of sales would remain unchanged. Still, the pace was higher than this time a year ago when the rate came in at 5.21 million. In the report, the median sales price for an existing home was $271,300, 5.4% higher than a year ago.
Consumers continued to boost their spending heading into the holiday season, buoyed by a rise in income and an optimistic outlook for the U.S. economy. Personal-consumption expenditures, or household spending, rose a seasonally-adjusted 0.4% in November the Commerce Department reported. The increase came alongside an increase in personal income, which was up 0.5%. Consumer spending accounts for more than two-thirds of U.S. economic output, and has propelled the economic expansion now in its eleventh year. Consumer also felt better about the economy according to the University of Michigan (UofM). UofM’s index of consumer sentiment was 99.3 this week, up from 96.8 in November. The reading was its highest since May. “The consumer sector appears to be in pretty good shape at this point. We should see that continue into 2020,” said Scott Brown, chief economist at Raymond James.
In the New York region, manufacturing activity remained subdued for a seventh consecutive month in December. The New York Federal Reserve reported its Empire State business conditions index ticked up 0.6 point to 3.5. Economists had expected a reading of 4.0. The headline index has been stuck in a range between 2 and 5 since July. In the details, the new orders index fell 2.9 points to 2.6, while shipments rose 3.1 points to 11.9. Most notably, optimism about the six-month outlook improved. However, analysts were quick to caution putting too much weight on the figure. Josh Shapiro, chief U.S. economist at MFR Inc. noted, “While [media] headlines made a big deal about the improvement in the 6-month expectations index, we caution that this is a volatile measure that does not do a very good job of foreshadowing what actual conditions will look like in six months.”
It was a similar story in manufacturing in Mid-Atlantic region. The Philadelphia Fed reported its manufacturing index fell in December to its lowest reading in six months. The regional Fed bank’s index fell to just 0.3 points from 10.4 in the prior month. Economists had expected a reading of 8. The headline index is based on a single stand‑alone question about business conditions. Of note, the components of the index were not as weak as the headline number with both new orders and shipments indexes rising. Nonetheless, according to Ian Shepherdson, chief economist as Pantheon Macroeconomics, in Philadelphia there is “No signs of manufacturing rebound here.”
International Economic News: Canadian retail sales plummeted unexpectedly in October, the latest in a series of disappointing economic data releases. Analysts state the poor reading could force the Bank of Canada to consider an interest rate cut. Statistics Canada reported retail trade dropped by 1.2%, missing economists’ estimates for a gain of 0.5% by a wide margin. Lower sales were reported in 8 of 11 subsectors, representing 81% of retail trade. CIBC Capital Markets Senior Economist Royce Mendes wrote in a note to clients, “Recent releases are likely enough for central bankers to at least begin discussing again whether easier financial conditions will be warranted in 2020”. The Bank of Canada has kept its overnight interest rate unchanged for more than a year even as several of its international counterparts eased.
Across the Atlantic, newly elected British Prime Minister Boris Johnson said he would essentially outlaw any extension to Britain’s transition period for leaving the European Union next year. After Johnson’s big election victory last week, many thought he would have more room to be flexible on the length of Britain’s transition out of the EU. Instead, Johnson put into place a self-imposed deadline of December 2020 to reach a trade deal with Europe. The limited time allowed was meant to “get Brexit done” supporters say. Analysts continue to debate whether it will be the EU or the UK to “blink first” in trade negotiations.
On Europe’s mainland France’s transportation troubles may ease up slightly this week, but unions plan renewed strikes and protests in January. Strikes began when French President Emmanuel Macron announced pension reforms such as raising the age for eligibility and reduced benefits. The UNSA union announced a “pause” in its railway strike for the end-of-year holidays, when families crisscross the country to be together. The SNCF rail authority said about half its trains should be running over the weekend. That’s up from just 10% earlier in the strike. Recent polls show a majority of the French still support the strikes and protests.
The German Institute for Economic Research (DIW) reported the German economy probably shrank in the fourth quarter as export-oriented manufacturing continued to decline. DIW said Europe’s largest economy probably contracted by 0.1% in the October-December period. DIW economist Claus Michelsen said, “We could at most hope for stagnation.” DIW’s forecast was in contradiction to the Munich-based Ifo Institute which stated Europe’s biggest economy likely expanded by 0.2% in the fourth quarter. The economy narrowly avoided recession in the third quarter, growing by 0.1% in the third quarter after contracting by 0.2% in the April-June period. Germany’s strong labor market is expected to continue providing support for the economy.
China’s economic activity was lifted by a raft of supportive central government policies, prompting many economists to raise their growth estimates for next year. Industrial output for November rose 6.2% from a year earlier, while retail sales surged 8% from a year earlier. The improved economic numbers, together with the limited trade deal announced by Beijing and Washington, could alleviate concerns about downside risks for the world’s second largest economy. After the release of the data, economists at UBS and Oxford Economics raised their forecasts for 2020 Chinese economic growth to 6%, up from earlier predictions for 5.7% growth.
Bank of Japan (BOJ) Governor Haruhiko Kuroda said the global economic outlook has brightened somewhat due to a preliminary U.S.-China trade deal but warned that risks to Japan’s recovery remain high. Kuroda made the comments after the BOJ’s widely expected decision to maintain its short-term rate target at -0.1% and the rate for 10‑year bond yields at around 0%. The central bank also kept intact its assessment that Japan’s economy continues to expand moderately as a trend, pointing to an expected boost to growth from the government’s $122 billion spending package. The decision to stand pat keeps Japan in line with the U.S. Federal Reserve and the European Central Bank, which have both signaled their respective monetary policies will be in a holding pattern for the time being.
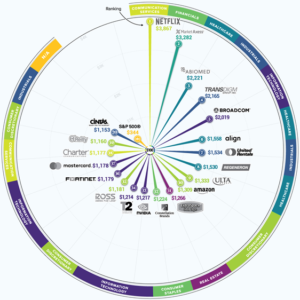
Finally: The stock market is in one of its longest bull market periods in history. Most investors have experienced good returns, but which stocks have actually performed the absolute best over the past decade? Analytical website Visual Capitalist scanned the current S&P 500 constituents for the top 20 ranked on current value of a $100 investment made on December 31, 2009 (including reinvested dividends). The top stock, Netflix, comes in at the head of the pack with a current value of a $100 investment of $3,867 – and is a name on the lips of millions daily. But most would not recognize many of the others, proving it is not just the “hot” stocks that “everybody is talking about” that rack up the big gains over time.
(Sources: all index return data from Yahoo Finance; Reuters, Barron’s, Wall St Journal, Bloomberg.com, ft.com, guggenheimpartners.com, zerohedge.com, ritholtz.com, markit.com, financialpost.com, Eurostat, Statistics Canada, Yahoo! Finance, stocksandnews.com, marketwatch.com, wantchinatimes.com, BBC, 361capital.com, pensionpartners.com, cnbc.com, FactSet) Securities offered through Registered Representatives of Cambridge Investment Research Inc., a broker-dealer, member FINRA/SIPC. Advisory Services offered through Cambridge Investment Research Advisors, a Registered Investment Adviser. Strategic Investment Partners and Cambridge are not affiliated.
Indices mentioned are unmanaged and cannot be invested into directly. Past performance is no guarantee of future results. All Investing involves risk. Depending on the types of investments, there may be varying degrees of risk. Investors should be prepared to bear loss, including total loss of principal.