
12-3-18 Weekly Market Update
The very big picture:
In the “decades” timeframe, the current Secular Bull Market could turn out to be among the shorter Secular Bull markets on record. This is because of the long-term valuation of the market which, after nine years, has reached the upper end of its normal range.
The long-term valuation of the market is commonly measured by the Cyclically Adjusted Price to Earnings ratio, or “CAPE”, which smooths out shorter-term earnings swings in order to get a longer-term assessment of market valuation. A CAPE level of 30 is considered to be the upper end of the normal range, and the level at which further PE-ratio expansion comes to a halt (meaning that increases in market prices only occur in a general response to earnings increases, instead of rising “just because”).
Of course, a “mania” could come along and drive prices higher – much higher, even – and for some years to come. Manias occur when valuation no longer seems to matter, and caution is thrown completely to the wind as buyers rush in to buy first and ask questions later. Two manias in the last century – the 1920’s “Roaring Twenties” and the 1990’s “Tech Bubble” – show that the sky is the limit when common sense is overcome by a blind desire to buy. But, of course, the piper must be paid and the following decade or two are spent in Secular Bear Markets, giving most or all of the mania gains back.
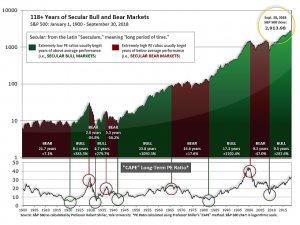
See Fig. 1 for the 100-year view of Secular Bulls and Bears. The CAPE is now at 30.94, up from the prior week’s 29.52, about the level reached at the pre-crash high in October, 2007. Since 1881, the average annual return for all ten year periods that began with a CAPE around this level have been in the 0% – 3%/yr. range. (see Fig. 2).

In the big picture:
The “big picture” is the months-to-years timeframe – the timeframe in which Cyclical Bulls and Bears operate. The U.S. Bull-Bear Indicator (see Fig. 3) is in Cyclical Bull territory at 54.53, up from the prior week’s 53.96.

In the intermediate and Shorter-term picture:
The Shorter-term (weeks to months) Indicator (see Fig. 4) turned positive on November 28th. The indicator ended the week at 9, up from the prior week’s 4. Separately, the Intermediate-term Quarterly Trend Indicator – based on domestic and international stock trend status at the start of each quarter – was positive entering October, indicating positive prospects for equities in the fourth quarter of 2018.

Timeframe summary:
In the Secular (years to decades) timeframe (Figs. 1 & 2), the long-term valuation of the market is simply too high to sustain rip-roaring multi-year returns – but the market has entered the low end of the “mania” range, and all bets are off in a mania. The only thing certain in a mania is that it will end badly…someday. The Bull-Bear Indicator (months to years) is positive (Fig. 3), indicating a potential uptrend in the longer timeframe. In the intermediate timeframe, the Quarterly Trend Indicator (months to quarters) is positive for Q4, and the shorter (weeks to months) timeframe (Fig. 4) is positive. Therefore, with three indicators positive and none negative, the U.S. equity markets are rated as Positive.
In the markets:
U.S. Markets: The major U.S. indexes rebounded strongly this week as Federal Reserve Chair Jerome Powell said that the federal funds rate is “just below” a neutral level (from his previous “a long way” from neutral), instantly moderating expectation of future interest rate hikes. The comments sparked a rally that lifted the S&P 500 to its best weekly gain since December of 2011. The Dow Jones Industrial Average surged over 1,250 points closing at 25,538, a gain of 5.2%. The technology-heavy NASDAQ Composite rallied 5.6%, ending the week at 7,330. By market cap, the large cap S&P 500 gained 4.8%, while the mid cap S&P 400 and small cap Russell 2000 each rose 3.0%.
International Markets: Canada’s TSX retraced all of last week’s loss by closing up by 1.2%. In Europe, the United Kingdom’s FTSE 100 rose 0.4%, while on the mainland France’s CAC 40 rose 1.2%, Germany’s DAX closed up 0.6%, and Italy’s Milan FTSE added 2.5%. In Asia, China’s Shanghai Composite added 0.3%, Japan’s Nikkei surged 3.3%, and Hong Kong’s Hang Seng rose 2.2%. As grouped by Morgan Stanley Capital International, developed markets rose 1.6%, while emerging markets jumped 3.4%.
Commodities: Precious metals finished the week slightly down with Gold losing a quarter of a percent to end the week at $1220.20 an ounce, while Silver gave up -0.2% to close at $14.22 an ounce. Oil had its first positive week in two months by rising 1.0%, closing at $50.93 per barrel for West Texas Intermediate crude. Copper, also known as “Dr. Copper” by some analysts for its ability to forecast global economic growth due to its variety of industrial uses, rose 0.76%.
November Summary: For the month of November, the Dow Jones Industrial Average rose 1.7%, while the NASDAQ Composite added just 0.3%. By market cap, the S&P 500 gained 1.8%, mid caps added 2.9%, and small caps rose 1.4%. Canada’s TSX rose 1.1%, while the FTSE retreated -2.1%. France’s CAC 40 shed -1.8%, Germany’s DAX lost -1.7%, but Italy’s Milan FTSE rose 0.7%. China’s Shanghai Composite was off -0.6%, while Japan’s Nikkei rose 2%. Developed markets as a group rose 0.5%, while emerging markets as a group rebounded by a much larger 4.9%. Precious metals were mixed, with gold rising 0.4% and silver slipping -0.4%. The industrial metal copper rose 4.9%. Oil was the worst asset class by a mile, plunging over -22%.
U.S. Economic News: The number of Americans who applied for first-time unemployment benefits last week hit a 6-month high, but the reading remained well below historical standards. The Labor Department reported that initial claims for unemployment insurance rose 10,000 to 234,000, its third consecutive increase. The consensus was for a decline of 4,000 to 220,000. The four-week moving average of claims, which smooths out the week-to-week volatility, rose 4,750 to 223,250—its highest level in five months. Still, the reading is extremely low by historical standards, and economists state labor market conditions remain tight.
The growth in home prices slowed to nearly a two-year low according to the latest data from S&P CoreLogic Case-Shiller National Home Price Index. The index rose 0.4% in September, while the year-over-year change pulled back to 5.5% – its slowest rate of growth since January 2017. In addition, both the 10-city and 20-city composite indexes posted smaller year-over-year gains than in recent months, an indication that the slow-down in house price appreciation is broad-based. In the details, the West was still the best with Las Vegas, San Francisco, and Seattle continuing to post the highest year-to-date gains; however, Seattle also experienced the largest home price decline in September.
Sales of new homes declined almost 9% last month, their biggest drop this year and back to levels not seen since March of 2016. Consensus expectations were for a 4.0% rebound to a 575,000 annual rate. Year-over-year sales were off -12%. Sales declined in all four regions of the country, both from the previous month and the same time a year ago. Inventory of new homes increased by 4.3% to 336,000, to its highest level since January of 2009. That brought the number of months of inventory up to 7.4 months, its highest level since February of 2011. Analysts generally consider six months of housing inventory a “balanced” housing market.
Confidence among the nation’s consumers pulled back slightly, according to the Conference Board’s Consumer Confidence Index which fell 2.2 points this month to 135.7—its first decline in five months. Still, the index remained near its highest level since October 2000 and continues to indicate above-trend economic expansion. The decline last month was predominantly due to a 4.1 point slide in consumer expectations, the most in almost a year, as the outlook for business conditions and income growth moderated. The present situation index—how Americans feel about the economy right now – rose 0.8 point to 172.7, its highest level since December 2000. Consumer purchasing plans for the next six months were broadly in line with seasonal expectations. Lynn Franco, senior director of economic indicators at the board noted, “Overall, consumers are still quite confident that economic growth will continue at a solid pace into early 2019. However, if expectations soften further in the coming months, the pace of growth is likely to begin moderating.”
In the Windy City, a broad measure of the U.S. economy from the Chicago Federal Reserve showed slightly stronger growth last month. The Chicago Fed National Activity Index increased to 0.24 in October from 0.14 in the previous month. Due to the volatile nature of this indicator, analysts prefer to look at the three-month moving average which ticked up to 0.31 from 0.30. This suggests a modest acceleration of economic growth during the course of the fourth quarter. Only one of the four broad categories of indicators increased last month, but three continued to make positive contributions to the index. The Chicago Fed index is a weighted average of 85 economic indicators, designed so that zero represents trend growth and a three-month average above 0.70 suggests an increasing likelihood of a period of sustained increasing inflation. The Diffusion Index, which is based on 85 individual indicators, climbed 0.08 point to 0.32—its highest level this year and consistent with above-trend growth.
The government’s Bureau of Economic Analysis reported that the economy grew 3.5% in the third quarter, matching consensus forecasts and keeping the economy on track for around 3% growth for the year. In addition, on a year-over-year basis, real GDP was up 3.0% – its fastest pace since the second quarter of 2015. In the details, corporate profits from current production increased 3.4% in the third quarter, the most since 2014. The increase was led by a solid gain in domestic nonfinancial industries. Profits were up 10.3% year-over-year as companies locked in benefits from the lower corporate tax rate. However, the main engine of the U.S. economy, consumer spending, rose at a 3.6% pace instead of the earlier-reported 4%, and the increase in state and local government spending was trimmed -1.2% to just 2%. Richard Moody, chief economist at Regions Financial summed up the report stating, “The bottom line here is that the U.S. economy carried a good deal of momentum into the home stretch of 2018 and 2019 should be another year of solid growth, even if growth falls a bit shy of this year’s pace.”
International Economic News: The pace of economic growth in Canada slowed in the third quarter as business investment spending fell and the growth in household spending slowed. Statistics Canada reported that the Canadian economy grew at an annualized pace of 2.0%, down from 2.9% the previous quarter. The reading was above the Bank of Canada’s forecast of 1.8% growth in the third quarter, and matched consensus expectations of a 2.0% advance. However, economists noted underlying details in the report that may foreshadow weakness ahead. Net trade added to quarterly growth, but that was due to weakness in imports. In addition, business investment declined noticeably, and weakness in the oil-and-gas sector is expected to continue through the fourth quarter. Doug Porter, chief economist at BMO Capital Markets summed up the report succinctly, “The details were unimpressive with a capital U.”
Across the Atlantic, Bank of England Governor Mark Carney and other government officials stated that large parts of the British economy are not ready for a “no-deal” Brexit. Mr. Carney stated fewer than half of businesses have initiated contingency plans. He denied that his warning was intended to scare people into backing his favored solution of Britain’s exit from the European Union. Some members of Parliament have warned that there was a “real prospect” of “major disruption” at UK ports in the case of a no-deal Brexit, with government plans “worryingly under-developed”. However, the Department for Transport said those conclusions “were not accurate”. Conservative Member of Parliament and Brexiter Jacob Rees-Mogg accused Mark Carney of promoting fear and that his statements “lack all credibility”. Rees-Mogg pointed out, “The overwhelming majority – 87% – of British companies do not trade with the European Union,” he said. “It will not have an effect on them. Leaving the European Union is a real economic opportunity and it’s an opportunity that neither the Bank of England nor the Treasury in its forecasts wishes to recognise,” Mr. Rees-Mogg added.
On Europe’s mainland, two in three people back the “yellow vest” protests and in a recent opinion poll 80% of French people consider President Emmanuel Macron’s measures “insufficient” to solve the taxation issue. Sixty-six percent of respondents stated they support the protests sparked by higher fuel taxes which have seen hundreds of thousands of protestors to take to the streets wearing the high-visibility yellow jackets that all motorists must carry. Macron has sought to defuse the unrest by pledging to defer future tax increases while the international price of oil is rising, and has also offered a three month public consultation aimed at helping France shift to a low-carbon economy without penalizing low-income families. But he refused to go back on an increase in fuel tax which is due to come into force in January, saying it is needed help fight pollution. While initially focused on fuel taxes, the “yellow vest” movement has snowballed into wider protests against economic hardship in provincial France and perceived elitism on Macron’s part. Seventy-eight percent of the 1,013 people questioned said the measures announced by the president were “wholly” or “mostly insufficient”.
Germany, Europe’s largest economy, showed its resilience as unemployment fell to a record low despite weaker business activity across the country. Germany’s jobless rate fell to 5.0% from 5.1% in November and the number of people out of work fell by 16,000, according to Germany’s Federal Employment Agency. The report supports the Bundesbank’s view that the economy is rebounding from a summer contraction. Germany’s Bundesbank expects a “fairly strong” expansion in the final quarter of 2018 with private consumption as the major driver.
Chinese President Xi Jinping and U.S. President Donald Trump are set to meet at the G-20 summit in Buenos Aires for a crucial discussion on trade. While analysts note that the prospect of a grand resolution between the two countries appears chancy at best, what is expected is some kind of blueprint for future talks. Ding Shuang, chief Greater China economist at Standard Chartered Bank noted, “It’s hard to reach an agreement at the G20 summit. The most likely scenario is that both agree to have further talks, so that the 25% tariffs on US$200 billion of Chinese merchandise can be postponed and the tension can be de-escalated.” A ceasefire in the escalating trade conflict between the U.S. and China would no doubt buoy global markets.
Retail sales in Japan rose the fastest in 10 months as consumers spent more on fuel, cars, and medicine. Analysts note the reading is a sign robust private consumption is likely to put the economy back on track for growth. Retail sales increased an annualized 3.5% in October from the same time last year, handily beating the median estimate of a 2.6% increase. It was the fastest annual gain since last December. Retail sales are a key indicator for Japan as it accounts for roughly 60% of the economy. This latest reading confirms that sales have risen for a full year, reflecting a tight labor market and gradual wage growth. Policymakers are counting on a rise in private consumption to help accelerate inflation to the central bank’s 2% target, as core consumer prices have risen just at half the price target despite more than five years of massive monetary stimulus.
Finally: As November came to a close, many investors who were diversified across numerous asset classes have seen a rather noticeable decline in the value of their investment accounts. While the first inclination may be to blame themselves or their financial advisor, the reality is that there were very few “safe havens” that avoided the October-November swoon. Research from Deutsche Bank shows that 90% of the 70 largest asset classes they follow are on track to post negative returns for the year. As Deutsche Bank notes, both stocks and bonds could both finish the year lower, a result that hasn’t happened in more than a quarter of a century.

(sources: all index return data from Yahoo Finance; Reuters, Barron’s, Wall St Journal, Bloomberg.com, ft.com, guggenheimpartners.com, zerohedge.com, ritholtz.com, markit.com, financialpost.com, Eurostat, Statistics Canada, Yahoo! Finance, stocksandnews.com, marketwatch.com, wantchinatimes.com, BBC, 361capital.com, pensionpartners.com, cnbc.com, FactSet) These are the opinions of WE Sherman and Co and not necessarily those of Cambridge, are for informational purposes only, and should not be construed or acted upon as individualized investment advice.
Securities offered through Registered Representatives of Cambridge Investment Research Inc., a broker-dealer, member FINRA/SIPC. Advisory Services offered through Cambridge Investment Research Advisors, a Registered Investment Adviser. Strategic Investment Partners and Cambridge are not affiliated.
Indices mentioned are unmanaged and cannot be invested into directly. Past performance is no guarantee of future results. All Investing involves risk. Depending on the types of investments, there may be varying degrees of risk. Investors should be prepared to bear loss, including total loss of principal.