
12-10-18 Weekly Market Update
The very big picture:
In the “decades” timeframe, the current Secular Bull Market could turn out to be among the shorter Secular Bull markets on record. This is because of the long-term valuation of the market which, after nine years, has reached the upper end of its normal range.
The long-term valuation of the market is commonly measured by the Cyclically Adjusted Price to Earnings ratio, or “CAPE”, which smooths out shorter-term earnings swings in order to get a longer-term assessment of market valuation. A CAPE level of 30 is considered to be the upper end of the normal range, and the level at which further PE-ratio expansion comes to a halt (meaning that increases in market prices only occur in a general response to earnings increases, instead of rising “just because”).
Of course, a “mania” could come along and drive prices higher – much higher, even – and for some years to come. Manias occur when valuation no longer seems to matter, and caution is thrown completely to the wind as buyers rush in to buy first and ask questions later. Two manias in the last century – the 1920’s “Roaring Twenties” and the 1990’s “Tech Bubble” – show that the sky is the limit when common sense is overcome by a blind desire to buy. But, of course, the piper must be paid and the following decade or two are spent in Secular Bear Markets, giving most or all of the mania gains back.
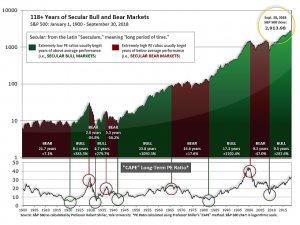
See Fig. 1 for the 100-year view of Secular Bulls and Bears. The CAPE is now at 29.54, down from the prior week’s 30.94, about the level reached at the pre-crash high in October, 2007. Since 1881, the average annual return for all ten year periods that began with a CAPE around this level have been in the 0% – 3%/yr. range. (see Fig. 2).

In the big picture:
The “big picture” is the months-to-years timeframe – the timeframe in which Cyclical Bulls and Bears operate. The U.S. Bull-Bear Indicator (see Fig. 3) is in Cyclical Bull territory at 52.60, down from the prior week’s 54.53.

In the intermediate and Shorter-term picture:
The Shorter-term (weeks to months) Indicator (see Fig. 4) turned positive on November 28th. The indicator ended the week at 13, up from the prior week’s 9. Separately, the Intermediate-term Quarterly Trend Indicator – based on domestic and international stock trend status at the start of each quarter – was positive entering October, indicating positive prospects for equities in the fourth quarter of 2018.

Timeframe summary:
In the Secular (years to decades) timeframe (Figs. 1 & 2), the long-term valuation of the market is simply too high to sustain rip-roaring multi-year returns – but the market has entered the low end of the “mania” range, and all bets are off in a mania. The only thing certain in a mania is that it will end badly…someday. The Bull-Bear Indicator (months to years) is positive (Fig. 3), indicating a potential uptrend in the longer timeframe. In the intermediate timeframe, the Quarterly Trend Indicator (months to quarters) is positive for Q4, and the shorter (weeks to months) timeframe (Fig. 4) is positive. Therefore, with three indicators positive and none negative, the U.S. equity markets are rated as Positive.
In the markets:
U.S. Markets: U.S. stocks fell sharply this week, with the technology-heavy NASDAQ Composite and smaller-cap indexes faring the worst. The Dow Jones Industrial Average plunged almost 1150 points ending the week at 24,388, a decline of -4.5%. The NASDAQ Composite shed 361 points, or -4.9%, to end the week at 6,969. By market cap, the large cap S&P 500 declined -4.6%, the mid cap S&P 400 fell -5.2%, and the small cap Russell 2000 brought up the rear by plunging -5.6%.
International Markets: Canada’s TSX retreated -2.6%, while the United Kingdom’s FTSE shed -2.9%. On Europe’s mainland, France’s CAC 40 ended down -3.8%, Germany’s DAX fell -4.2%, and Italy’s Milan FTSE retreated -2.3%. In Asia, Japan’s Nikkei fell -3.0o%, but China’s Shanghai Composite finished up 0.7%, making it the one and only major international market to end the week in positive territory. As grouped by Morgan Stanley Capital International, developed markets fell -3.2%, while emerging markets fell -2.9%.
Commodities: Precious metals were bid higher amidst the market turmoil. Gold finished up for a fourth consecutive week, adding 2.2% to close at $1252.60 an ounce, while Silver rose 3.4% to $14.70 an ounce. Likewise, energy managed a second week of gains with oil rebounding 3.3% to close at $52.61 per barrel of West Texas Intermediate crude oil. The industrial metal copper, viewed by analysts as a barometer of global economic health due to its variety of uses, finished the week down -1.0%.
U.S. Economic News: In economic news, the number of Americans seeking new unemployment benefits fell by just 4,000 last week to 231,000 vs analyst expectations of a decline of 10,000. The decline broke a string of three consecutive increases that had pushed the claims number up to its highest level since the end of March. The more stable monthly average of new claims rose by 4,250 to 228,000. That number is at its highest level in eight months. Still, readings below 300,000 have historically been associated with a strong economy, and readings below 250,000 are considered exceptional. Continuing claims, which counts the number of people already receiving benefits, fell by 74,000 to 1.63 million.
Private payrolls processor ADP reported the U.S. added 179,000 private sector jobs last month. The increase was a three-month low and below the consensus forecast of 190,000 new positions. In addition, October’s gain was revised down slightly to 225,000 new jobs versus the previously estimated 227,000. Still the trend in hiring remained strong. In the details of the report, small firms added 46,000 positions while medium-sized businesses added 119,000 and large companies added 13,000. Services continued to lead the hiring with the professional and business sector adding 59,000 jobs, education and health adding 49,000, and leisure and hospitality adding 26,000. Manufacturing added just 4,000 new jobs—the fewest in two years.
The Bureau of Labor Statistics’ monthly Non-Farm Payrolls report showed growth in jobs may have peaked as nonfarm payrolls expanded by 155,000, more than 40,000 fewer than economists had expected. In addition, payrolls were revised down by an additional 12,000 over the prior two months. Overall, however, the unemployment rate remained near a 49-year low of 3.7%. And although hiring fell short of expectations, the increase in new jobs was still double the number of people entering the labor force each month. Senior U.S. economist Eric Winograd of AllianceBernstein noted, “None of the information released today represents a paradigm change for the economy—the labor market is strong and continues to get stronger.” The increase in jobs was concentrated in health care, manufacturing, transportation, and white-collar businesses.
Manufacturing bounced back last month, according to the Institute for Supply Management (ISM). ISM reported its Manufacturing Index rebounded 1.6 points to 59.3 in November, its first increase in three month s. The reading is consistent with above-trend economic growth. Analysts had expected just a 0.2 point gain. ISM estimated its latest index reading corresponds with a 4.9% annualized rate of real GDP growth, however most estimates are closer to a 3.0% growth rate. The net share of industries reporting steady growth was at 72%, also indicating above-trend expansion. Four of the five components of the index increased last month, led by ‘new orders’ which jumped 4.7 points. Separately, research firm IHS Markit’s Purchasing Managers’ Index (PMI) reported its U.S. Manufacturing PMI fell 0.4 points to 55.3. In that survey, ‘new orders’ also showed strong growth, but production growth eased. Cost burdens declined but still are at high levels reflecting tariffs and supplier shortages. Business optimism about the next year fell to their lowest level since September of 2017 as survey respondents expressed concerns about the sustainability of new orders growth.
The Federal Reserve reported most of its 12 districts saw modest to moderate growth from mid-October through late November in its latest “Beige Book”. The Beige Book report is a collection of anecdotal information on current economic conditions from each of its district banks. Overall the Beige Book was positive but acknowledged some headwinds. On the positive side, consumer spending remained steady and tariffs have thus far not impaired manufacturing activity, while on the negative side new home construction and existing home sales have declined in several regions and lending volume has showed only slight growth.
Sentiment among the nation’s consumers remains upbeat according to the latest data from the University of Michigan. U of M’s Consumer Sentiment Index remained unchanged at 97.5, holding on to the gains achieved over the last two years. Economists had expected a 0.2 point decline to 97.3. In the details, consumers were slightly more optimistic on current conditions, but a bit more pessimistic of the future. The University of Michigan said the last time the sentiment index was consistently above 90 was between 1997 and 2000, when it recorded a four-year average of 105.3. Including December’s report, the sentiment index has averaged 97.5 over the last two years.
International Economic News: Canada added a record number of jobs last month and its unemployment rate dipped to an all-time low, Statistics Canada reported. Canada’s jobless rate fell to 5.6% as over 94,000 new jobs were added to the economy. The data will provide some relief for the Bank of Canada, which left rates unchanged this week due to recent “disappointing” economic data. In the details, full-time jobs surged by 89,900 on stronger private sector hiring while part-time positions edged up by 4,100. The 94,100 increase in the number of jobs created – a 0.5% month-on-month jump – is the largest on record, eclipsing the 94,000 mark set in March of 2012.
Across the Atlantic, economic growth in the United Kingdom has “stalled” according to the latest reading from research firm IHS Markit’s Purchasing Managers’ Index (PMI). Growth in the UK’s key services sector hit its lowest level since July of 2016 in its November reading, hitting a level of just 50.4, down from 52.2 in October. A reading of 50 is the dividing line between expansion and contraction. Chris Williamson, chief business economist at IHS Markit stated, “The survey results suggest that the pace of economic growth has stalled.” The services sector accounts for about 80% of the UK economy. The last time the index was this low was immediately after the UK’s referendum vote to leave the European Union.
In France, for a fourth consecutive week antigovernment protests turned violent as demonstrators in Paris burned cars and tore down barricades while police used tear gas and water cannons to control the crowds. The so-called “yellow vest” protests, named for the bright yellow safety vests all motorists must carry, were initially due to a planned increase in the fuel tax but has now morphed into broader anger at President Emmanuel Macron’s economic policies and France’s declining living standards. Macron’s approval rating has hit a new low of just 23%, matching Francois Hollande in 2013. Till now, Hollande had been generally considered the least popular leader in modern French history.
A loyalist to German Chancellor Angela Merkel won a tight race to succeed her as party leader this week, increasing the likelihood that Merkel will be allowed to complete her fourth term and stay in office until 2021. Annegret Kramp-Karrenbauer pledged to maintain continuity while opening up the Christian Democratic Union (CDU) party to a more grassroots democracy. In a brief address, she called on the party to reject the politics of “fear” as the far right makes greater inroads in Germany and Europe in response to mass immigration. “We must have the courage to stay the course against the Zeitgeist,” she said.
China, according to customs data, reported far weaker than expected exports and imports in November, showing that both global and domestic demand is slowing. November exports rose just 5.4% from a year earlier—well short of consensus expectations for 10%, while import growth was just 3%. Analysts were expecting imports to grow over 14%. Analysts state the export data showed that the “front-loading” impact as manufacturers rushed out shipments ahead of U.S. tariffs had faded, and that export growth was likely to continue to slow as demand cools. With regards to imports, analysts note that shipments into the country of iron ore had fallen for a second month, reflecting waning demand at steel mills. Economists in recent months have noted deterioration in China’s export outlook in 2019, factoring in higher U.S. tariffs on a wider range of Chinese goods. Chinese policymakers are expected to offer more policy support and deliver more support measures if domestic and external conditions continue to deteriorate.
In a major shift for a country that has long resisted immigration, Japan plans to accept more than 300,000 blue-collar foreign workers to help tackle labor shortages under a new bill passed by Parliament. In some sectors, such as construction and nursing care, the number of job vacancies is more than four times the number of job seekers. Japan’s population started falling around 2010 due to persistent low birth rates, while steady economic growth boosted job opportunities. Earlier this year, the jobless rate fell to its lowest level since 1992. The new law will create two new visa categories: one for manual workers who can stay for five years and one for higher-skilled blue-collar workers who can stay indefinitely. The government expects about 340,000 workers to get permission to work in Japan under the plan in the first five years.
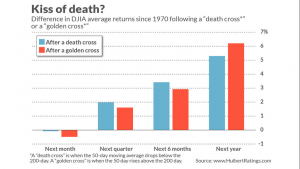
Finally: As the major market indexes have fallen of late, one after another has experienced what’s known as a “Death Cross”, a technical market pattern that occurs when an index’s 50-day moving average crosses below its 200-day moving average. Its dreadful name would suggest that every investor in the world should run for the hills whenever one occurs—but is that the prudent thing to do? Mark Hulbert, financial columnist at Marketwatch, decided to take a look. Going back to 1970, Hulbert found that the Dow Jones Industrial Average has endured 34 “Death Crosses”, followed eventually by the opposite, the so-called “Golden Cross” when the 50-day moving average crosses back above the 200-day moving average. His study showed that on average, the market has actually performed somewhat better following Death Crosses than it has following Golden Crosses over the following month, quarter and 6 month periods! As he notes, this is exactly the opposite of what market folklore would lead us to believe.
(sources: all index return data from Yahoo Finance; Reuters, Barron’s, Wall St Journal, Bloomberg.com, ft.com, guggenheimpartners.com, zerohedge.com, ritholtz.com, markit.com, financialpost.com, Eurostat, Statistics Canada, Yahoo! Finance, stocksandnews.com, marketwatch.com, wantchinatimes.com, BBC, 361capital.com, pensionpartners.com, cnbc.com, FactSet) These are the opinions of WE Sherman and Co and not necessarily those of Cambridge, are for informational purposes only, and should not be construed or acted upon as individualized investment advice.
Securities offered through Registered Representatives of Cambridge Investment Research Inc., a broker-dealer, member FINRA/SIPC. Advisory Services offered through Cambridge Investment Research Advisors, a Registered Investment Adviser. Strategic Investment Partners and Cambridge are not affiliated.
Indices mentioned are unmanaged and cannot be invested into directly. Past performance is no guarantee of future results. All Investing involves risk. Depending on the types of investments, there may be varying degrees of risk. Investors should be prepared to bear loss, including total loss of principal.