
11-26-18 Weekly Market Update
The very big picture:
In the “decades” timeframe, the current Secular Bull Market could turn out to be among the shorter Secular Bull markets on record. This is because of the long-term valuation of the market which, after nine years, has reached the upper end of its normal range.
The long-term valuation of the market is commonly measured by the Cyclically Adjusted Price to Earnings ratio, or “CAPE”, which smooths out shorter-term earnings swings in order to get a longer-term assessment of market valuation. A CAPE level of 30 is considered to be the upper end of the normal range, and the level at which further PE-ratio expansion comes to a halt (meaning that increases in market prices only occur in a general response to earnings increases, instead of rising “just because”).
Of course, a “mania” could come along and drive prices higher – much higher, even – and for some years to come. Manias occur when valuation no longer seems to matter, and caution is thrown completely to the wind as buyers rush in to buy first and ask questions later. Two manias in the last century – the 1920’s “Roaring Twenties” and the 1990’s “Tech Bubble” – show that the sky is the limit when common sense is overcome by a blind desire to buy. But, of course, the piper must be paid and the following decade or two are spent in Secular Bear Markets, giving most or all of the mania gains back.
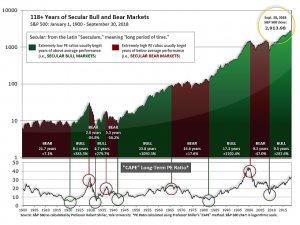
See Fig. 1 for the 100-year view of Secular Bulls and Bears. The CAPE is now at 29.52, down from the prior week’s 30.72, about the level reached at the pre-crash high in October, 2007. Since 1881, the average annual return for all ten year periods that began with a CAPE around this level have been in the 0% – 3%/yr. range. (see Fig. 2).

In the big picture:
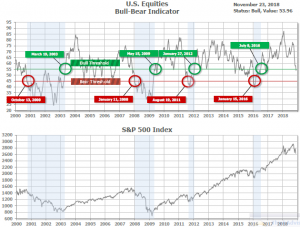
The “big picture” is the months-to-years timeframe – the timeframe in which Cyclical Bulls and Bears operate. The U.S. Bull-Bear Indicator (see Fig. 3) is in Cyclical Bull territory at 53.96, down from the prior week’s 57.00.
In the intermediate and Shorter-term picture:
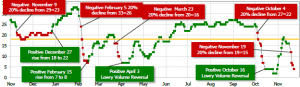
The Shorter-term (weeks to months) Indicator (see Fig. 4) turned positive on October 16th. The indicator ended the week at 4, down sharply from the prior week’s 16. Separately, the Intermediate-term Quarterly Trend Indicator – based on domestic and international stock trend status at the start of each quarter – was positive entering October, indicating positive prospects for equities in the fourth quarter of 2018.
Timeframe summary:
In the Secular (years to decades) timeframe (Figs. 1 & 2), the long-term valuation of the market is simply too high to sustain rip-roaring multi-year returns – but the market has entered the low end of the “mania” range, and all bets are off in a mania. The only thing certain in a mania is that it will end badly…someday. The Bull-Bear Indicator (months to years) is positive (Fig. 3), indicating a potential uptrend in the longer timeframe. In the intermediate timeframe, the Quarterly Trend Indicator (months to quarters) is positive for Q4, and the shorter (weeks to months) timeframe (Fig. 4) is negative. Therefore, with two indicators positive and one negative, the U.S. equity markets are rated as Neutral.
In the markets:
U.S. Markets: U.S. stocks endured a second week of losses, primarily due to sell-offs on Monday and Tuesday. Declines were particularly evident in technology stocks, but energy stocks were also particularly weak as crude oil prices continued to tumble. The Dow Jones Industrial Average fell over 1120 points last week, ending the week at 24,285, a loss of -4.4%. The Nasdaq Composite gave up 309 points, to close at 6,938, a loss of -4.3%. By market cap, the large cap S&P 500 fell -3.8%, the mid cap S&P 400 index gave up -2.2%, and the small cap Russell 2000 ended the week down -2.5%.
International Markets: Canada’s TSX fell 1.0%, while across the Atlantic the United Kingdom’s FTSE ended down ‑0.9%. Major mainland European markets also finished in the red: France’s CAC 40 fell -1.6%, Germany’s DAX retreated -1.3% and Italy’s Milan FTSE ended down -0.9%. In Asia, China’s Shanghai Composite reversed last week’s gain by falling -3.7%. Japan’s Nikkei ended the week down a slight -0.16%. As grouped by Morgan Stanley Capital International, developed markets fell -1.9% while emerging markets ended down -2.8%.
Commodities: Precious metals ended the week mixed. Gold rose just $0.20, closing at $1223.20 an ounce, while Silver reversed most of last week’s gain by falling -1.0% and ending the week at $14.24 an ounce. Energy continued to trade down. Crude oil fell for a seventh consecutive week, collapsing over 11% to $50.42 per barrel. The industrial metal copper, viewed by analysts as an indicator of global economic growth due to its variety of uses, retraced some of last week’s gain by falling -1.1%.
U.S. Economic News: The number of people applying for new unemployment benefits rose by 3,000 to 224,000, hitting its highest level in over four months. Economists had expected claims to decline by 2,000 to 214,000. Notably, the previous week’s reading was revised up by 5,000 to 221,000. The monthly average of new claims, smoothed to iron out the weekly volatility, also increase by 2,000 to 218,500. Still, although the level of claims rose they remained low both by historical standards and compared to the size of the labor force.
Confidence among the nation’s home builders tumbled the most in four years as multiple factors continued to weigh. The National Association of Home Builders’ (NAHB) monthly confidence index plunged eight points to 60 for November. Economists had expected just a one point decline to 67. The reading was the index’s biggest decline since February of 2014, and the third biggest drop on record. All three of the NAHB’s Housing Market Index’s components posted notable losses. Expected single-family home sales plunged ten points as builders noted growing affordability concerns. Labor remains expensive, lots are scarce, and the costs for raw materials such as lumber continue to rise. Confidence declined across the country, with the West particularly hard hit. In areas that have been impacted by wild fires, confidence fell to its lowest level since September 2015.
The Commerce Department reported housing starts ticked up 1.5% last month to a 1.228 million unit annual rate, below the consensus forecast of a 2.4% increase. Single-family starts, which account for 70% of total starts, fell in three of the four regions, down -1.8%. Multifamily starts, such as townhomes and apartment buildings, rose 6.2%. Permits, which analysts use to forecast future building activity, edged down -0.6% to a 1.263 million unit annual rate. Economists had expected an increase of 2.3%. Both housing starts and permits posted modest declines year-over-year, suggesting weakening momentum.
Sales of existing homes rebounded 1.4% last month for their first gain in seven months. The National Association of Realtors (NAR) reported existing home sales ran at a seasonally-adjusted annual rate of 5.22 million, beating forecasts of a 0.8% gain to a 5.19 million unit rate. The increase was led by a 5.3% jump in condominium/co-op sales, their most in almost a year. Single-family sales were up a modest 0.9%. However, despite the gain, existing home sales were down 5.1% from the same time last year—the most since August 2014. In the details of the NAR report, the median sales price of a home in October was $255,400, up 3.8% from a year ago. In addition, the months of supply ticked down to 4.3 from 4.4 (6 months is generally considered a “balanced” housing market). This suggests housing inventory remains tight.
Leading indicators show that the U.S. economy continues to grow, but the pace of that growth is expected to moderate. The Conference Board’s Leading Economic Index (LEI) edged up 0.1% in October, its smallest gain in five months, but beating expectations for an unchanged reading. Five the ten LEI components advanced last month, led by stronger consumer expectations. Over the past six months, the strength among the individual indicators has diminished, but still remains consistent with broad-based growth. Ataman Ozyildirim, economist at the board, stated “The index still points to robust economic growth in early 2019, but the rapid pace of growth may already have peaked. While near-term economic growth should remain strong, longer-term growth is likely to moderate to about 2.5% by mid- to late 2019.” The LEI is a weighted gauge of 10 indicators designed to signal peaks and valleys in the business cycle.
Americans are still optimistic about the U.S. economy, but the recent stock market volatility has made wealthier households more anxious about their financial situations. The University of Michigan’s consumer sentiment index fell 1.1 point to 97.5 this month. The index has been down in four of the past five months, indicating a gradual erosion in consumer sentiment. Both the current conditions and expectations sub-indexes declined. Of note, the biggest decline in sentiment occurred among the wealthiest one-third of U.S. households. This stands to reason, as wealthier Americans are more likely to have more invested in the stock market. In contrast, sentiment among Americans in the bottom third rose sharply.
Orders for goods expected to last at least 3 years, so-called “durable goods”, sank 4.4% in October but it was predominantly due to a drop in demand for aircraft. The decline was its biggest drop in 15 months; economists had expected just a 3.4% decline. Stripping out the transportation segment, orders rose a slight 0.1%. Nondefense capital goods orders ex-aircraft, or core business orders, posted a marginal decline for the third month in a row. On a year over year basis, durable goods orders increased 8.6%, while core orders were up 4.3% with both readings moderating in recent months. While some economists contend the slowdown is likely to be temporary, others suggest the effects of a slowing global economy may be hitting U.S. shores. Economists at Oxford Economics wrote in a note, “Looking ahead, we expect momentum to continue to fade as reduced tailwinds from fiscal stimulus dissipate and rising headwinds from slower global growth, reduced energy investment and heightened trade tensions start weighing on capex plans.”
International Economic News: Canada’s Finance Minister Bill Morneau announced this week that there will be no corporate tax cuts in Canada like those introduced in the United States by President Donald Trump. Instead, Morneau announced a package of tax write-offs and investments that the government says will effectively reduce the corporate tax rate in Canada from 17% to 13.8%. Morneau’s fiscal outlook stated, “The U.S federal tax reform has significantly reduced the overall tax advantage that Canada has built over the years, posing important challenges that, if left unaddressed, could have significant impacts on investment, jobs and the economic prospects of middle class Canadians.”
Since the United Kingdom voted to leave the European Union in the so-called “Brexit” vote, the economic gap between the south and north of England has widened, according to the Economic Statistics Centre of Excellence. The regional economic growth forecasts showed that, after adjusting for inflation, London’s economy has grown roughly 5% since the referendum, compared to growth of about 1.3% in the Northeast of England. A briefing on potential future trading arrangements predicted that the north of England could fall further behind the south because of the relatively higher concentration of manufacturing businesses in the north which would be hampered by trade frictions. The Economics Statistics Centre of Excellence provides the UK’s Office for National Statistics with research to improve the measurement of the modern economy.
In a second week of “yellow vest” protests, French police fired tear gas and used water cannons to disperse protestors in Paris who are angry over rising fuel costs and President Emmanuel Macron’s economic policies. For more than a week, protestors wearing the fluorescent yellow jackets (that all motorists in France must have in their cars) have blocked highways across the country with burning barricades and convoys of slow-moving trucks. They are opposed to taxes Macron introduced last year on diesel and gasoline which are designed to encourage people to shift to more environmentally friendly transport. Last Saturday, nearly 300,000 people took part in the first “yellow vest” demonstrations nationwide.
For the first time since 2015, Germany’s economy has fallen into contraction, led by a drop in exports and private consumption. In its final reading, the 0.2% decline in the third quarter matched the preliminary reading. The reading is sure to lead to debate at the European Central Bank over whether it can afford to end its stimulus programs by the end of the year as planned. In the details, trade was the biggest drag on growth, subtracting one percentage point from GDP, while reduced private consumption subtracted another 0.1%. The Bundesbank was quick to suggest that the drop was only temporary and that it expects to see “fairly strong growth again” by the fourth quarter as car production returns to normal following new emission-testing rules.
China’s latest economic data shows that growth is slowing, with no signs of improvement anytime soon. Chinese economic growth slowed in the third quarter to its slowest in 10 years, while data from October – the first month of the fourth quarter – indicated that economic growth had slowed even further. The China Association of Automobile manufacturers reported total vehicle sales dropped 11.7% from a year earlier in the world’s largest auto market, while the National Bureau of Statistics reported real estate floor space sold, a proxy for property sales volume, fell by 3.1%. In addition, research firm Canalys reported that third quarter Chinese smartphone shipments slipped 15.2% from the same period last year to 100.6 million.
Japan’s Cabinet Office maintained its headline assessment of the economy stating that it is “recovering at a moderate pace” in the latest edition of its monthly economic report. The Cabinet Office stated Japan’s economy continues to show improvement amid solid domestic demand, though heightened trade tensions and other risks warrant attention. In addition, it stated that private consumption, which accounts for more than half of the domestic economy, is “picking up” while spending by companies is “increasing”. Exports are “almost flat” as a slump in demand for smartphones in Asia weighed on orders for electronic components and manufacturing equipment. In regards to the growing trade tensions between the U.S. and China the office said, “Attention should be given to risks including the effects of situations concerning trade issues on the world economy, the uncertainty in overseas economies and the effects of fluctuations in financial and capital markets.”
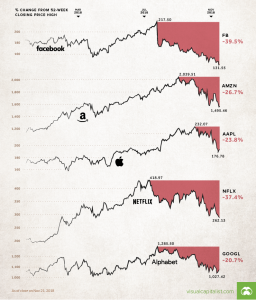
Finally: As an example of how quickly assets in the financial markets can go from “hero to zero”, the website visualcapitalist.com created a graphic to show the true carnage that has occurred among recent tech market leaders. The so-called “FAANG” stocks (Facebook, Amazon, Apple, Netflix, and Google) have now each officially dropped in to “bear” market territory—defined as a drop of 20% of more from a recent high. Facebook has fared the worst, down almost 40%, while Google is off “just” -20.7%. As you might expect, these stocks have been the favorites of younger investors, who have taken it on the chin of late.
(sources: all index return data from Yahoo Finance; Reuters, Barron’s, Wall St Journal, Bloomberg.com, ft.com, guggenheimpartners.com, zerohedge.com, ritholtz.com, markit.com, financialpost.com, Eurostat, Statistics Canada, Yahoo! Finance, stocksandnews.com, marketwatch.com, wantchinatimes.com, BBC, 361capital.com, pensionpartners.com, cnbc.com, FactSet) These are the opinions of WE Sherman and Co and not necessarily those of Cambridge, are for informational purposes only, and should not be construed or acted upon as individualized investment advice.
Securities offered through Registered Representatives of Cambridge Investment Research Inc., a broker-dealer, member FINRA/SIPC. Advisory Services offered through Cambridge Investment Research Advisors, a Registered Investment Adviser. Strategic Investment Partners and Cambridge are not affiliated.
Indices mentioned are unmanaged and cannot be invested into directly. Past performance is no guarantee of future results. All Investing involves risk. Depending on the types of investments, there may be varying degrees of risk. Investors should be prepared to bear loss, including total loss of principal.