
12-26-2023 Weekly Market Update
The very Big Picture
The long-term valuation of the market is commonly measured by the Cyclically Adjusted Price to Earnings ratio, or “CAPE”, which smooths-out shorter-term earnings swings in order to get a longer-term assessment of market valuation. A CAPE level of 30 is considered to be the upper end of the normal range, and the level at which further PE-ratio expansion comes to a halt (meaning that further increases in market prices only occur as a general response to earnings increases, instead of rising “just because”). The market was recently above that level and has fallen back.
Of course, a “mania” could come along and drive prices higher – much higher, even – and for some years to come. Manias occur when valuation no longer seems to matter, and caution is thrown completely to the wind – as buyers rush in to buy first, and ask questions later. Two manias in the last century – the “Roaring Twenties” of the 1920s, and the “Tech Bubble” of the late 1990s – show that the sky is the limit when common sense is overcome by a blind desire to buy. But, of course, the piper must be paid, and the following decade or two were spent in Secular Bear Markets, giving most or all of the mania-gains back.
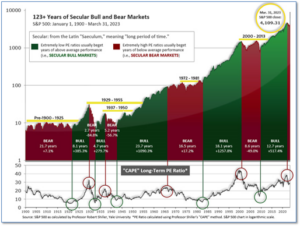
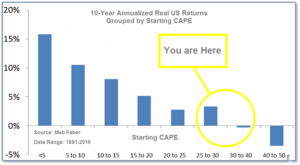
See Fig. 1 for the 100-year view of Secular Bulls and Bears. The CAPE is now at 32.16, up from the prior week’s 31.92. Since 1881, the average annual return for all ten-year periods that began with a CAPE in this range has been slightly positive to slightly negative (see Fig. 2).
Note: We do not use CAPE as an official input into our methods. However, if history is any guide – and history is typically ‘some’ kind of guide – it’s always good to simply know where we are on the historic continuum, where that may lead, and what sort of expectations one may wish to hold in order to craft an investment strategy that works in any market ‘season’ … whether the current one, or one that may be ‘coming soon’!
The Big Picture:
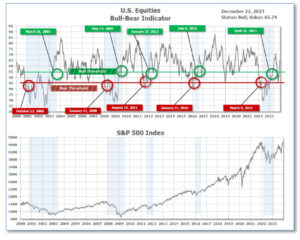
The ‘big picture’ is the (typically) years-long timeframe – the timeframe in which Cyclical Bulls and Bears operate. The U.S. Bull-Bear Indicator finished the week in Bull territory at 65.74 up from the prior week’s 63.18.(see Fig. 3)
In the Quarterly- and Shorter-term Pictures
The Quarterly-Trend Indicator based on the combination of U.S. and International Equities trend-statuses at the start of each quarter – was Positive entering July, indicating positive prospects for equities in the third quarter.
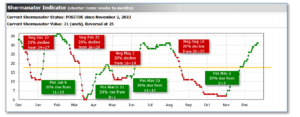
Next, the short-term(weeks to months) Indicator for US Equities turned positive on November 2, and ended the week at 31, up 2 from the prior week.
In the Markets:
U.S. Markets: Stocks continued their positive streak as investors grew more assured that the economy would avoid a recession. The S&P 500 Index temporarily moved within 84 basis points of an intraday high since the start of 2022. Meanwhile, the Nasdaq 100 Index and Dow Jones Industrial Average also performed well. The Dow Jones Industrial Average ticked up 0.2%, closing the week at 37,386. The technology-heavy NASDAQ added 1.2%. By market cap, the large cap S&P 500 gained 0.8%, while the mid cap S&P 400 increased by 1.5%. The small cap Russell 2000 advanced 2.5%.
International Markets: The international indexes finished the week mixed. Canada’s TSX increased 1.7%, while the UK’s FTSE 100 rose 1.6%. France’s CAC 40 dropped -0.4%, while Germany’s DAX fell by -0.3%. In Asia, China’s Shanghai Composite retreated -0.9% for the second straight week. Japan’s Nikkei ticked up 0.6%. As grouped by Morgan Stanley Capital International, developed markets gained 1.8%, while emerging markets rose by 0.4%.
Commodities: Precious metals were up this week. Gold rose 1.64% to $2,069.10 an ounce and Silver gained 1.70% to $24.57. The industrial metal copper, viewed by some analysts as a barometer of world economic health due to its wide variety of uses, increased 0.37%. West Texas Intermediate crude oil was in the green for its second consecutive week as it gained 2.48% and rose to $73.56 per barrel.
U.S. Economic News: The Commerce Department’s report showed inflation pressures continued to subside. Inflation, as measured by the personal consumption expenditures (PCE) price index, ticked down 0.1% in November. The drop marked the first monthly decline in the PCE price index since April of 2020 and followed an unchanged reading in October. Food prices edged down 0.1%, while energy prices shed 2.7%. After rising 2.9% in October, the PCE price index increased 2.6% in the 12 months through November. Excluding food and energy, the PCE price index rose 0.1% last month. “Fed Chair Jerome Powell couldn’t have asked for a better present this year,” said Sal Guatieri, a senior economist at BMO Capital Markets in Toronto. “So far at least, the endgame is turning out better than the Fed or nearly anyone could have imagined at the start of the year. While the Fed won’t rush into cutting rates, it’s likely now just a matter of time,” added Guatieri.
Layoffs remained low during the holiday season as the number of Americans who applied for unemployment benefits ticked up less than expected. New jobless claims tend to be volatile around the holiday shopping season, between Thanksgiving to January, due to temporary hiring. New jobless claims totaled 205,000, the government said. Economists had expected new claims to total 215,000. While layoffs remained historically low, some businesses cut back on hiring. The number of people collecting unemployment benefits was mostly unchanged at 1.87 million. “Initial claims remain at levels consistent with relatively few layoffs,” said Nancy Vanden Houten, the lead U.S. economist of Oxford Economics.
Existing home sales inched up in November. According to the National Association of Realtors, sales of previously owned homes increased by 0.8% to an annual rate of 3.82 million. Economists had forecasted existing-home sales would total 3.76 million for last month. However, when compared to November of 2022, existing-home sales were down by 7.3% and prices were up by 4%. The median price for an existing home rose in November to $387,600. The National Association of Realtors noted that around 19% of properties were sold above the listed price. The total number of homes for sale increased 0.9% to 1.13 million units since last year. Across the U.S., sales of existing homes were mixed. The South reported the highest number of sales with an increase of 4.7%, while the median price of a home reached $351,500. “The reality is that homeowners sitting on 3% or 4% mortgages are still unlikely to be enticed to move by current mortgage rate levels, even as the demand for homes is reportedly already picking up,” Stephen Stanley, chief U.S. economist at Santander U.S. Capital Markets, wrote in a note.
Construction of new homes in the U.S. advanced 14.8% last month. Stronger home-buying demand spurred the pace of construction amid a shortage of homes for sale. Housing starts grew from 1.36 million in November to an annual pace of 1.56 million, the government said. The peak for housing starts was at 1.8 million in April of 2022. The recent data exceeded the expected rate of 1.36 million. The construction pace of single-family homes gained 18% in November, while the construction of apartment buildings rose by 8.9%. By region, single-family housing starts ticked down 0.8% in the West. Whereas in the Northeast, builders heavily ramped up construction. More modest increases were reported in the remaining regions. “Housing starts have been volatile in recent months,” Ali Jaffery at CIBC Economics wrote in a note. “While mortgage rates have eased substantially since their peak in late October, today’s release likely reflects noise rather than the influence of gradually improving demand. We expect a pullback next month,” said Jaffery.
In a recent survey, builders were optimistic about home-buying demand, but continued to cut prices to keep buyers interested. The National Association of Home Builders’ (NAHB) monthly confidence index rose by 3 points to 37 in December. The index stood at 31 in 2022. Builders had kept sales incentives up, while 36% cut home prices. The NAHB said this was unchanged from November’s reading. The average price cut was 6%. To improve sales this month, approximately 60% of builders used incentives, other than price cuts, to boost interest. The NAHB reported that mortgage rates shed nearly 50 basis points over the last month. Lower rates ensured lower borrowing costs for families interested in purchasing a home, alongside lower costs for builders. “The housing market appears to have passed peak mortgage rates for this cycle, and this should help to spur home buyer demand in the coming months, with the component measuring future sales expectations going up six points in December,” chief economist at the NAHB, Robert Dietz, said in a statement.
International Economic News: In Canada, retail sales improved at the start of the fourth quarter, but likely flattened in November. Retail sales ticked up 0.7% to C$66.95 billion ($50.19 billion) in October, data from Statistics Canada showed. In volume terms, retail sales had increased 1.4%. However, sales in November were likely unchanged, the agency said. Seven out of nine subsectors reported sales had increased, which represented 84.1% of Canada’s retail trade. According to deputy chief North America economist at Capital Economics, Stephen Brown, inventories-to-sales ratios were elevated. Brown said there was a notable risk that a drawdown would keep GDP growth weak, despite it being marginally positive. “Our tracking for fourth quarter GDP now suggests virtually no growth during the period, which is all the more disappointing given surging population growth,” said Desjardins Group economist Tiago Figueiredo.
Across the Atlantic, British businesses grew more pessimistic about the economic outlook in December. The Lloyds Bank Business Barometer, which surveyed 1,200 firms across the economy, dropped by seven points from November’s 21-month high of 42% to 35% this month. However, December’s reading remained above the survey’s average of 28%. Paul Gordon, a managing director at Lloyds Bank, said the economic outlook “remains tough.” Businesses should prioritize a strong cashflow and look carefully at staffing, Gordon added. Lloyds’ survey showed hiring intentions had eased, while the proportion of companies planning to increase salaries rose. “Businesses are also balancing cost pressures with a challenging labour market that will see increases to minimum wage in April 2024 at a time when they are managing staff retention and recruitment decisions,” said senior economist at Lloyds, Hann-Ju Ho.
On Europe’s mainland, Germany made a $55 billion deal with Europe’s largest gas producer, Norway. Securing Energy for Europe (SEFE), a German state-owned energy firm, and Norway’s Equinor announced a 50-billion-euro gas deal, which will cover a third of the gas Germany’s industrial sector needs. The deal increased Norway’s share of Germany’s gas supply to nearly 60%, comparable to the amount Russia used to provide. Analysts said that supply disruption of gas has decreased, but Germany could run into technical issues. Tobias Federico, analyst at Berlin-based consultancy Energy Brainpool, said LNG could increase diversification and Germany should learn from the mistakes of the past. Henning Gloystein, director of energy, climate, and resources at the consultancy Eurasia Group, said the number of pipelines offered some protection, but protecting pipelines that run over great distances would be difficult. According to LSEG data, production outages in Norway earlier this year drove up prices and caused pipeline flows from the country to European customers to drop to a decade low. Despite the downsides of Norwegian dependence, German industry remains dependent on gas as an energy source. According to Anders Opedal, chief executive of state-owned Equinor, the deal will supply Germany with 129bn cubic meters of gas until 2039, which would suffice for a third of the country’s industrial demand.
Banque de France governor Francois Villeroy de Galhau said interest rates will be lowered in 2024. The central bank’s governor also forecasted France’s inflation will decline to 2% by 2025. “Inflation has been the number one concern for French people, and that is starting to go back down,” said Francois Villeroy de Galhau. This followed the European Central Bank’s stance that borrowing costs would remain high despite lower inflation expectations. According to the Banque de France governor, there was some slowdown in the French economy, but there was no recession. “I am going to say this very clearly this morning – this is not just a forecast; this is a commitment. We will bring back inflation down to 2% between now and 2025 at the very latest,” said Villeroy.
China’s steel demand this year is set to decline 3.3% year-on-year. Officials at the China Metallurgical Industry Planning and Research Institute (MPI) said the world’s top steel producer will consume 890 million metric tons in 2023. According to official data, China manufactured 952.14 million tons of crude steel throughout this year, which was a 1.5% increase from 2022. However, the debt-ridden property sector added pressure to China’s steel industry. Demand for construction steel declined by 4.8%, to 506 million tons, compared to last year, researchers at MPI said. China’s steel exports in 2024 could slightly fall, said Guan Zhijie, vice general engineer at MPI, as economic growth overseas slows. “The issuance of one trillion yuan of sovereign debt as well as local government debts that are frontloaded in the fourth quarter of 2023 will support the infrastructure sector in 2024,” said Xiao Bangguo, vice president of MPI.
In Japan, the core consumer price index (CPI) decelerated last month, which provided the central bank with more time to phase out its monetary stimulus. Japan’s core inflation, which excludes food and fuel costs, rose 2.5% last month year-on-year. This followed a 2.9% gain in October and marked its slowest pace since 2022. Services inflation rose from 2.1% in October to 2.3% last month. While service prices continued to increase, it may not be enough for the Bank of Japan to exit its ultra-loose policy. “Inflation is coming down as supply-side factors that pushed up prices fade. Meanwhile, evidence of demand-driven inflation, a by-product of strong domestic spending and wage gains, remains preciously scarce,” said Jeemin Bang, an associate economist at Moody’s Analytics. The central bank’s ultra-loose policy remained intact, and Governor Kazuo Ueda stressed the need for the bank to continue scrutinizing whether a positive wage-inflation cycle will fall into place. “We expect companies to keep raising service prices, though there’s no change to our view that overall inflation will slow as a trend,” said Takeshi Minami, chief economist at Norinchukin Research Institute. “The BOJ probably won’t normalize policy for the time being,” Minami added.
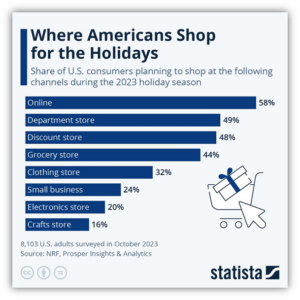
Finally: If you felt like a year of high prices, high interest rates, and high economic uncertainty would scare away shoppers this Holiday season, you may be surprised to hear that doesn’t seem to be the case. Apparently, gift-buying is a categorical imperative to most American consumers. According to Statista’s Felix Richter, forecasts and preliminary estimates suggest new spending records this year. The National Retail Federation expects an average of $885 to be spent on core holiday items, such as decorations and gifts. This is 5% higher than the holiday budgets in 2022 and slightly above the five-year average in expected spending. As to where U.S. consumers planned to shop this year, 58% said they intended to shop online, while 49% planned to go to a department store. Consumers who planned to shop at a discount store and those who made holiday purchases at a grocery store were at 48% and 44%, respectively. It may seem like many Americans like to avoid the bustling crowds in Who-ville by shopping online, but physical stores still hold their own during the year’s most active shopping season.
(Sources: All index- and returns-data from Norgate Data and Commodity Systems Incorporated; news from Reuters, Barron’s, Wall St. Journal, Bloomberg.com, ft.com, guggenheimpartners.com, zerohedge.com, ritholtz.com, markit.com, financialpost.com, Eurostat, Statistics Canada, Yahoo! Finance, stocksandnews.com, marketwatch.com, wantchinatimes.com, BBC, 361capital.com, pensionpartners.com, cnbc.com, FactSet.) Content provided by WE Sherman and Company. Securities offered through Registered Representatives of Cambridge Investment Research Inc., a broker-dealer, member FINRA/SIPC. Advisory Services offered through Cambridge Investment Research Advisors, a Registered Investment Adviser. Strategic Investment Partners and Cambridge are not affiliated. Indices mentioned are unmanaged and cannot be invested into directly. Past performance is no guarantee of future results. These opinions of Strategic Investment Partners and not necessarily those of Cambridge Investment Research, are for informational purposes only and should not be construed or acted upon as individualized investment advice.