
1-1-2024 Weekly Market Update
The very Big Picture
The long-term valuation of the market is commonly measured by the Cyclically Adjusted Price to Earnings ratio, or “CAPE”, which smooths-out shorter-term earnings swings in order to get a longer-term assessment of market valuation. A CAPE level of 30 is considered to be the upper end of the normal range, and the level at which further PE-ratio expansion comes to a halt (meaning that further increases in market prices only occur as a general response to earnings increases, instead of rising “just because”). The market was recently above that level and has fallen back.
Of course, a “mania” could come along and drive prices higher – much higher, even – and for some years to come. Manias occur when valuation no longer seems to matter, and caution is thrown completely to the wind – as buyers rush in to buy first, and ask questions later. Two manias in the last century – the “Roaring Twenties” of the 1920s, and the “Tech Bubble” of the late 1990s – show that the sky is the limit when common sense is overcome by a blind desire to buy. But, of course, the piper must be paid, and the following decade or two were spent in Secular Bear Markets, giving most or all of the mania-gains back.
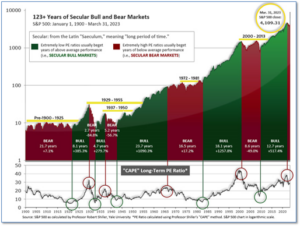
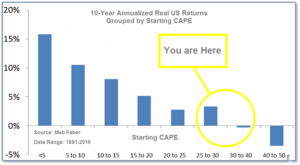
See Fig. 1 for the 100-year view of Secular Bulls and Bears. The CAPE is now at 32.27, up from the prior week’s 32.16. Since 1881, the average annual return for all ten-year periods that began with a CAPE in this range has been slightly positive to slightly negative (see Fig. 2).
Note: We do not use CAPE as an official input into our methods. However, if history is any guide – and history is typically ‘some’ kind of guide – it’s always good to simply know where we are on the historic continuum, where that may lead, and what sort of expectations one may wish to hold in order to craft an investment strategy that works in any market ‘season’ … whether the current one, or one that may be ‘coming soon’!
The Big Picture:
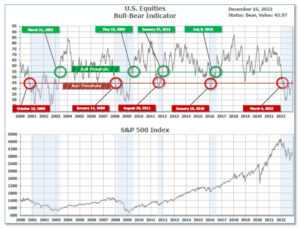
The ‘big picture’ is the (typically) years-long timeframe – the timeframe in which Cyclical Bulls and Bears operate. The U.S. Bull-Bear Indicator finished the week in Bull territory at 68.20 up from the prior week’s 65.74.(see Fig. 3)
In the Quarterly- and Shorter-term Pictures
The Quarterly-Trend Indicator based on the combination of U.S. and International Equities trend-statuses at the start of each quarter – was Positive entering July, indicating positive prospects for equities in the third quarter.
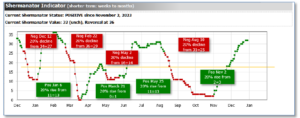
Next, the short-term(weeks to months) Indicator for US Equities turned positive on November 2, and ended the week at 31, up 2 from the prior week.
In the Markets:
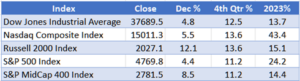
U.S. Markets: Trading volumes and market moves were modest through the holiday-shortened week, which was widely expected. However, the week closed out a strong year for the major indexes. The Nasdaq Composite recorded its sixth largest annual gain since the index was launched in 1971. The Dow Jones Industrial Average rose 0.8%, closing the week at 37,690. The technology-heavy NASDAQ ticked up 0.1%. By market cap, the large cap S&P 500 increased by 0.3%, while the mid cap S&P 400 ticked down -0.2%. The small cap Russell 2000 shed -0.3%.
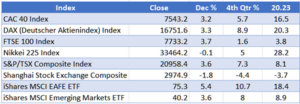
International Markets: The majority of the international indexes finished the week in the green. Canada’s TSX and the UK’s FTSE 100 rose by 0.4% and 0.5%, respectively. France’s CAC 40 shed -0.3%, while Germany’s DAX ticked up 0.3%. In Asia, China’s Shanghai Composite climbed 2.1% for the first time in two weeks. Japan’s Nikkei increased by 0.9%. As grouped by Morgan Stanley Capital International, developed markets rose 0.8%, while emerging markets gained 2.1%.
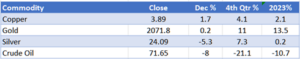
Commodities: Most precious metals finished the week negative. Gold ticked up 0.13% to $2,071.80 an ounce, while Silver retreated -1.95% to $24.09. The industrial metal copper, viewed by some analysts as a barometer of world economic health due to its wide variety of uses, shed -0.37%. West Texas Intermediate crude oil lost -2.60% and fell to $71.65 per barrel.
U.S. Economic News: The S&P CoreLogic Case-Shiller 20-city house-price index surged a seasonally adjusted 0.6% from September to October. Home prices in the 20 major U.S. metropolitan markets were up an average of 4.9% year-on-year, Case-Shiller said. The national index, a more expansive measure of home prices, also showed a 0.6% increase in October and rise of 4.8% year-on-year. In the 20-city index, home-prices in Detroit were up 8.1% year-on-year, which was the highest of the gains posted. San Diego and New York followed at 7.2% and 7%, respectively. Portland, Oregon was the only city to have a decrease in home-prices in October. “With mortgage rates dropping, demand for homes in early 2024 is likely to be strong and will again put pressure on prices, similar to trends observed in early 2023,” said Selma Hepp, chief economist at CoreLogic, in a statement. “Annual home price appreciation should accelerate this winter before slowing again next year. Still, most markets will continue to reach new home price highs over the course of 2024,” Hepp added.
Jobless claims rose for the second consecutive week. The U.S. Labor Department said initial jobless claims added 12,000 to a total of 218,000. This was below economists’ estimation for a 215,000 increase. The number of Americans who had received jobless benefits rose by 14,000 to 1.875 million. On an unadjusted basis, claims advanced 31,570 to 272,610. Texas reported a sharp decrease in claims, followed by sixteen other states. Ohio, Oklahoma, Michigan, Connecticut, and Massachusetts saw the largest increase in initial claims from the previous week. Economists forecast job growth to drop off over the new year. “Initial jobless claims ticked up last week but remain near this year’s lows while continuing claims resumed their upward trend,” said Kathy Jones, chief fixed income strategist at the Schwab Center for Financial Research.
The U.S. trade deficit in goods grew 0.8% to $90.3 billion last month, the Commerce Department’s advance estimate showed. This surpassed an estimation of $89.6 billion made by economists. Wholesale inventories declined 0.2%, while retail inventories ticked down 0.1%, the report showed. Meanwhile, exports of goods retreated 3.6% to $165.1 billion, and imports decreased by 2.1% to $255.4 billion in November. Economists forecast the downward trend in exports and imports will continue into next year as growth in major global trading partners slows.
The monthly index released by the National Association of Realtors showed that pending home sales flattened from October to November. The Pending Home Sales Index remained unchanged at 71.6 last month. However, pending home sales had decreased by 5.2% year-on-year. The Northeast saw a rise in sales, along with the Midwest and West, but had declined in the South. As mortgage rates declined over the past quarter, economists anticipate a modest rebound in home sales ahead. Torsten Slock, chief economist at Apollo Global Management, said a potential rebound could cause housing inflation to remain elevated and complicate the Fed’s job of lowering inflation to their 2% target. “Although declining mortgage rates did not induce more homebuyers to submit formal contracts in November, it has sparked a surge in interest, as evidenced by a higher number of lockbox openings,” said NAR chief economist, Lawrence Yun, in a statement.
International Economic News: Canada’s economy gathered momentum in the wrong direction towards the new year. Households and businesses pulled back on spending as the Bank of Canada held interest rates at high levels and inflation remained ahead of the central bank’s target range. In October, real gross domestic product was unchanged, according to a report from Statistics Canada. Economists had expected a 0.2% increase. October marked the fifth consecutive month that the Canadian economy reported negative or unchanged month-over-month growth, said economists at National Bank of Canada. The report found that within the private sector, over two-thirds of the sectors posted stagnant or negative growth over the last six months. “This is a bitter setback as population growth remains staggering,” the report said.
Across the Atlantic, Britain’s economic prospects look rosier in 2024, as growth is set to outpace some G7 rivals. A report from accountancy giant PwC proposed that the UK will hold a spot in the middle of G7 nations in economic performance compared to pre-Covid levels. With growth between 2019 and 2024 at 2.7%, the UK would be ahead of 2.4% in France, Japan at 1.5%, and Germany coming in at 1.2%. The report forecasted inflation will hit the Bank of England’s 2% target in the first quarter of 2025. Falling inflation, alongside the increase in the national living wage to £11.44 an hour, is expected to help households that feel squeezed. However, various ‘known unknowns,’ such as volatility in global energy prices and the forthcoming General Election, could throw the UK off course next year. Yet, Britain’s 2024 outlook is overall rosier than was expected 12 months ago.
On Europe’s mainland, major international companies launched expansion projects in Europe’s largest economy this year. Dresden was chosen by Taiwanese chipmaker TSMC as the site for its new semiconductor production facility, worth € 10 billion. In the fourth quarter, American pharmaceutical and MedTech giant Eli Lilly and Company announced a € 2.3 billion expansion in the German city of Alzey. Furthermore, Germany continued to perform well this year in terms of foreign direct investment. “Projects like the ones being launched by TSMC and Lilly demonstrate Germany’s continuing appeal as a location from which to prosper in the European Union and beyond,” said Robert Hermann, CEO of Germany Trade & Invest (GTAI). “While we expect the raw number of FDI projects to decline somewhat in 2023, the big-ticket expansions, the ones that have the greatest economic impact, are continuing. That’s a sign of both the economic might and the appeal of Germany as a place to do business,” Hermann added.
In Asia, the slowdown in the world’s second largest economy is expected to continue into 2024. While most economists forecasted that China would hit its official growth target of around 5% in 2023, the economy’s property crisis, weak spending, and high youth unemployment have increased a pessimistic outlook for 2024. A third quarter survey by the American Chamber of Commerce in Shanghai showed that 48% of respondents were pessimistic about their five-year business outlook. “Policymakers seem to believe that with a bit of stimulus and a turnaround in sentiment, the economy can get back on a stronger path,” said Julian Evans-Pritchard, head of China Economics at Capital Economics. “Most of the slowdown reflects a structural decline in productivity and income growth, rather than cyclical weakness that can be addressed through demand-side stimulus or other confidence-boosting measures,” added Evans-Pritchard.
Bank of Japan Governor Kazuo Ueda said the likelihood was “gradually rising” for the central bank to reach its inflation target. “If the virtuous cycle between wages and prices intensifies and the likelihood of achieving our price target in a sustainable and stable manner rises sufficiently, we will likely consider changing policy,” Ueda said. However, due to economic uncertainty, the specific timing to change the BoJ’s loose monetary stance was undecided. “We will carefully examine economic developments as well as firms’ wage- and price-setting behavior, and thereby decide on future monetary policy in an appropriate manner,” the BoJ governor said. Japan’s prolonged experience of stagnant wage growth had heightened the public’s perception that prices and wages would remain around zero. Changing that perception and creating a cycle where wages and prices rose in tandem would lead to more efficient allocation of labor. “The likelihood of Japan’s economy getting out of the low-inflation environment and achieving our price target is gradually rising, though the likelihood is still not sufficiently high at this point,” Ueda said. “Since there are extremely high uncertainties surrounding the economy and prices at home and abroad, it’s necessary to examine how firms’ wage- and price-setting behavior will change,” he added.
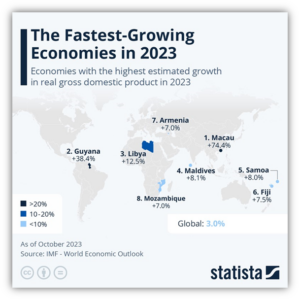
Finally: Which economies do you think have grown the fastest this year? Perhaps your mind immediately gravitated to countries within the G7 or the BRICS. According to the International Monetary Fund, a country with a population of 800,000 recorded the highest growth rate this year. The real gross domestic product of Guyana, a country located on the north-eastern coast of South America, is expected to have grown by 38.4% in 2023. Oil production was the main factor behind Guyana emerging as a significant economic force. The oil and gas company ExxonMobil discovered oil deposits, with an estimated total volume of up to ten billion barrels, off the coast of Guyana eight years ago. The oil deposits have fueled many things, including a flare-up of tensions with Venezuela. The neighboring country claims most of the waters off the coast of Guyana. By economy, Macau in China outperformed Guyana this year. The Chinese Special Administrative Region of Macau enticed vibrant entertainment and commerce through 2023. Tourism, gambling, and real estate were the major industries which helped Macau’s gross domestic product surge 74.4%.
(Sources: All index- and returns-data from Norgate Data and Commodity Systems Incorporated; news from Reuters, Barron’s, Wall St. Journal, Bloomberg.com, ft.com, guggenheimpartners.com, zerohedge.com, ritholtz.com, markit.com, financialpost.com, Eurostat, Statistics Canada, Yahoo! Finance, stocksandnews.com, marketwatch.com, wantchinatimes.com, BBC, 361capital.com, pensionpartners.com, cnbc.com, FactSet.) Content provided by WE Sherman and Company. Securities offered through Registered Representatives of Cambridge Investment Research Inc., a broker-dealer, member FINRA/SIPC. Advisory Services offered through Cambridge Investment Research Advisors, a Registered Investment Adviser. Strategic Investment Partners and Cambridge are not affiliated. Indices mentioned are unmanaged and cannot be invested into directly. Past performance is no guarantee of future results. These opinions of Strategic Investment Partners and not necessarily those of Cambridge Investment Research, are for informational purposes only and should not be construed or acted upon as individualized investment advice.