
11-27-2023 Weekly Market Update
The very Big Picture
The long-term valuation of the market is commonly measured by the Cyclically Adjusted Price to Earnings ratio, or “CAPE”, which smooths-out shorter-term earnings swings in order to get a longer-term assessment of market valuation. A CAPE level of 30 is considered to be the upper end of the normal range, and the level at which further PE-ratio expansion comes to a halt (meaning that further increases in market prices only occur as a general response to earnings increases, instead of rising “just because”). The market was recently above that level and has fallen back.
Of course, a “mania” could come along and drive prices higher – much higher, even – and for some years to come. Manias occur when valuation no longer seems to matter, and caution is thrown completely to the wind – as buyers rush in to buy first, and ask questions later. Two manias in the last century – the “Roaring Twenties” of the 1920s, and the “Tech Bubble” of the late 1990s – show that the sky is the limit when common sense is overcome by a blind desire to buy. But, of course, the piper must be paid, and the following decade or two were spent in Secular Bear Markets, giving most or all of the mania-gains back.
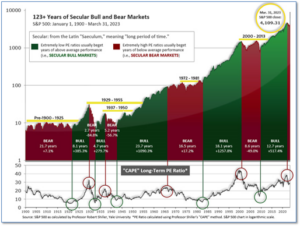
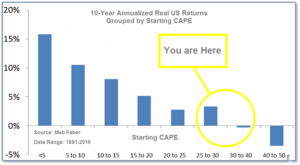
See Fig. 1 for the 100-year view of Secular Bulls and Bears. The CAPE is now at 30.86, up from the prior week’s 30.56. Since 1881, the average annual return for all ten-year periods that began with a CAPE in this range has been slightly positive to slightly negative (see Fig. 2).
Note: We do not use CAPE as an official input into our methods. However, if history is any guide – and history is typically ‘some’ kind of guide – it’s always good to simply know where we are on the historic continuum, where that may lead, and what sort of expectations one may wish to hold in order to craft an investment strategy that works in any market ‘season’ … whether the current one, or one that may be ‘coming soon’!
The Big Picture:
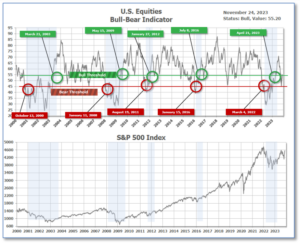
The ‘big picture’ is the (typically) years-long timeframe – the timeframe in which Cyclical Bulls and Bears operate. The U.S. Bull-Bear Indicator finished the week in Bull territory at 55.20 up from the prior week’s 52.57(see Fig. 3)
In the Quarterly- and Shorter-term Pictures
The Quarterly-Trend Indicator based on the combination of U.S. and International Equities trend-statuses at the start of each quarter – was Positive entering July, indicating positive prospects for equities in the third quarter.
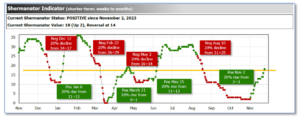
Next, the short-term(weeks to months) Indicator for US Equities turned positive on November 2, and ended the week at 13, up 2 from the prior week.
In the Markets:
U.S. Markets: The major indexes finished in the green over a holiday-shortened trading week. Markets were closed on Thursday in observance of the Thanksgiving holiday and early on Friday. The Dow Jones Industrial Average rose 443 points finishing the week at 35,390—an increase of 1.3%. The technology-heavy NASDAQ ticked up 0.9%. By market cap, the large cap S&P 500 added 1.0%, while the mid cap S&P 400 grew 0.9%. The small cap Russell 2000 finished the week up 0.5%.
International Markets: International indexes finished the week mixed. Canada’s TSX shed -0.4%, while the UK’s FTSE 100 dropped -0.2%. France’s CAC 40 gained 0.8%, while Germany’s DAX was up 0.7%. In Asia, China’s Shanghai Composite lost -0.4%. Japan’s Nikkei finished the week up 0.1%. As grouped by Morgan Stanley Capital International, developed markets gained 1.0%. Emerging markets ticked up 0.5%.
Commodities: Precious metals advanced this week. Gold increased by 0.92% to $2,003.00 an ounce and Silver gained 2.05% to $24.34. The industrial metal copper, viewed by some analysts as a barometer of world economic health due to its wide variety of uses, grew 1.35%. West Texas Intermediate crude oil pulled back for its fifth consecutive week giving up -0.66% to $75.54 per barrel.
U.S. Economic News:
U.S. existing-home sales slumped as prices accelerated. The National Association of Realtors reported that existing home sales tumbled 4.1% last month to a seasonally adjusted annual rate of 3.79 million units. According to the report, the high mortgage rates in October drove buyers from the market. Economists had forecasted home sales would slide to a rate of 3.90 million units. Sales fell in the Northeast, West, and in the heavily populated South. Whereas, the Midwest, the most affordable region, remained unchanged. “The combination of high prices, high mortgage rates, and millions of homeowners unwilling to move, given they’ve locked in low rates, has frozen the market,” said Robert Frick, corporate economist at Navy Federal Credit Union.
The number of Americans applying for unemployment benefits dropped sharply last week. The Labor Department reported that jobless claims fell from last week’s 233,000 to 209,000. The four-week moving average of claims, which evens out week-to-week volatility, shed 750 to 220,000. While jobless claims continued to decrease, the hiring rate has slowed. Employers added nearly 400,000 jobs last year. Over the course of 2023, monthly hiring has averaged 239,000. “But job growth remains strong, the unemployment rate remains historically low, and businesses have yet to start reducing their workforce in a significant way, ″ said Rubeela Farooqi, chief U.S. economist at High Frequency Economics. “We expect some softening in labor demand going forward as the effects of restrictive monetary policy spread more broadly through the economy,” Farooqi added.
U.S. durable-goods orders receded as demand weakened in the transportation equipment sector. The Commerce Department’s Census Bureau said that orders for durable goods dropped by 5.4%, or $16 billion. Economists had forecasted a decline of 3.1%. Transportation equipment orders declined 14.8% last month. Motor vehicles and parts orders shed 3.8%. Civilian aircraft orders tumbled 49.6%. On the bright side, orders for computers, electronic products, and fabricated metal products increased. “Excluding transportation, new orders were virtually unchanged,” the Commerce Department’s Census Bureau said. “Excluding defense, new orders decreased 6.7%. Transportation equipment, also down three of the last four months, drove the decrease, $16.0 billion, or 14.8%, to $92.1 billion,” the statement read.
Consumer sentiment improved slightly this month, but Americans remain concerned about inflation. The sentiment survey edged up from 60.4 to 61.3, but higher prices for goods and services, alongside higher borrowing costs, are increasing economic stress on consumers. A measurement of expectations for the subsequent six months ticked down from an initial 56.9 to 56.8. Americans think inflation will average 4.5% in 2024, up from 3.2% in September. According to the director of the survey, Joanne Hsu, “Consumers appear worried that the softening of inflation could reverse in the months and years ahead.”
The U.S. economy expanded at a relatively slow pace this month. The S&P Global “flash” U.S. services index rose from 50.6 to 50.8 in November. Economists had forecasted a reading of 50.2. Sian Jones, principal economist at S&P Global Market Intelligence, said demand conditions had improved as new orders expanded for the first time in four months. “The upturn was historically subdued, however, amid challenges securing orders as customers remained concerned about global economic uncertainty, muted demand and high interest rates,” Jones added. Services activity ticked up to 50.8, while the gauge of manufacturing fell from 50.0 to 49.4. S&P Global said that the overall reading remained relatively unchanged as cost pressures softened. As input prices climbed at a subdued pace, higher service sector output charges increased the rate of total selling price inflation, it added. “Although ticking up slightly, selling price inflation remained subdued relative to the average over the last three years and was consistent with a rate of increase close to the Fed’s 2% target,” Jones said.
International Economic News: Canada’s recent fiscal update forecasted higher deficits and debt than previously expected. The finance ministry reported higher deficit spending in its mid-year fiscal update. The deficit was increased to C$38.4 billion in 2024/25 from C$35.0 billion respectively. Meanwhile, the federal debt-to-GDP ratio was updated to increase for a year longer than previously forecasted. “They’re pushing back the beginning of the debt decline,” said Robert Asselin, senior vice president of policy at the Business Council of Canada. “That suggests to me they’re not on a sustainable fiscal track and they need to rein in their spending,” Asselin added. Prime Minister Justin Trudeau’s government remains pressured to curb spending as Canadians continue to struggle under higher living costs and housing affordability. However, the central bank warned of the effects spending could have on encouraging inflation. “The government recognizes it is constrained in how much it can spend, but it’s spending up to that line all the time,” said Randall Bartlett, senior director of Canadian economics at Desjardins Group. “To me, that doesn’t speak to prudence,” added Bartlett.
Across the Atlantic, British companies reported growth in November, after three months of contraction. The S&P Global/CIPS UK Composite Purchasing Managers’ Index (PMI) showed a preliminary reading of 50.1 this month. Economists had expected a reading of 48.7, unchanged from the reading in October. The manufacturing sector came in at 46.7, which marked a six-month high, but remained out of positive territory. After the central bank paused its interest rate hikes, firms seemed slightly more optimistic about their prospects for the year ahead. “Relief at the pause in interest rate hikes and a clear slowdown in headline measures of inflation are helping to support business activity, although the latest survey data merely suggests broadly flat UK GDP in the final quarter of 2023,” Tim Moore, economics director at S&P Global Market Intelligence said.
Germany’s economy shrunk slightly in the third quarter. Data from the German Federal Statistical Office, Destatis, confirmed an initial estimate that showed Europe’s largest economy had contracted by 0.1%. Year-on-year, Germany’s adjusted gross domestic product, GDP, contracted by 0.4%. “After the weak economic development seen in the first half of 2023, the German economy began the second half of the year with a slight drop in performance,” said Ruth Brand, president of the statistics office. High energy costs, weak global orders, and higher interest rates were listed as the foremost constraints on Germany’s economy. Destatis reported that private consumer spending, which accounts for approximately two-thirds of GDP, fell by 0.3% from the second quarter. However, government consumer spending increased by 0.2%, it added. “Government austerity measures could lead to an additional dampening of growth,” VP Bank Chief Economist, Thomas Gitzel, said. “It is unlikely that private consumption or investment will suddenly pick up,” Gitzel added.
Business activity in France dropped off this month as demand for goods and services in the euro zone’s second largest economy deteriorated. The Manufacturing Purchasing Managers Index (PMI), released by S&P Global and Hamburg Commercial Bank, came in at 45.3. Economists had forecasted a flash services PMI of 45.6 points. The flash November composite PMI – which accounts for both the services and manufacturing sectors – ticked down to 44.5 points from 44.6 in October. “The French economy is kind of in a dead-end. Output has declined for the sixth month in a row, especially precipitated by lower demand overall and from abroad. Both sectors’ activity levels – manufacturing and services – declined significantly in November,” said Hamburg Commercial Bank economist Norman Liebke. “The inflation threat remains at large. The latest PMI data indicates that prices are still rising sharply, suggesting that official inflation statistics could remain at higher-than-anticipated levels for longer than previously thought,” Liebke added.
China’s property sector crunch could affect oil demand in 2024. The world’s largest oil importer is forecasted to drop demand in the first quarters of next year as builders and manufacturers decrease diesel consumption. The Organization of Petroleum Exporting Countries expected Chinese demand to average 16.41 million barrels per day in 2024, while the International Energy Agency (IEA) forecasted demand averaging 17.1 million barrels per day. Meanwhile, China’s ongoing property sector crunch could offset weaker demand. Builders, who consume vast quantities of diesel to power construction equipment, have been using less as new construction dropped off 15.2% last year, according to data from the National Bureau of Statistics. The manufacturing sector, another prominent diesel user, has struggled amid weak export demand and fallout from the property slowdown. Shiqing Xia, an oil and chemicals consultant at Woodmac, forecasted diesel consumption to drop by 2% annually in the first quarter. “The main downside risk to oil demand could come from diesel demand during the off-season in Q1 2024,” said Xia.
Japan’s factory activity shrank in November as demand softened. The au Jibun Bank flash Japan manufacturing purchasing managers’ index (PMI) slipped to 48.1 from 48.7 in October. The index has remained below the 50.0 threshold for its sixth consecutive month. Both output and new orders eased, while manufacturers reduced staffing for the second month in a row. “Activity at Japanese private sector firms stagnated midway through the fourth quarter of 2023,” said Usamah Bhatti, economist at S&P Global Market Intelligence. The au Jibun Bank Flash Japan composite PMI, which combines both manufacturing and service sector activity, came in at 50.0 in November, down 0.5 points from October’s reading. “Demand conditions at private sector firms remained muted in November and were little-changed from October,” Bhatti added.
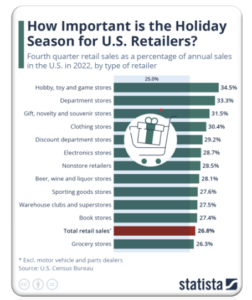
Finally: The weeks leading up to Christmas are generally perceived as the most important time of the year for retailers in the U.S. According to the National Retail Federation, Americans will be spending between $957 and $967 billion in November and December, with average spending for holiday-related items to amount to $875 per consumer. When retail sales are evenly distributed throughout the year, the period between October through December accounts for 25% of the year’s total sales. While retailers tend to be reliant upon this time of year, perhaps some retailers are more reliant than others. According to retail sales figures published by the U.S. Census Bureau, dependence upon holiday season sales varies between types of retailers. Most retailers’ holiday sales clock in above the 25% benchmark. Hobby, toy and game stores generated 34.5% of their annual sales in the final quarter of 2022. However, some retailers aren’t as ecstatic for the holiday quarter as it tends to deliver subpar results. These retailers include car dealerships, gas stations, building material, and supplies dealers.
(Sources: All index- and returns-data from Norgate Data and Commodity Systems Incorporated; news from Reuters, Barron’s, Wall St. Journal, Bloomberg.com, ft.com, guggenheimpartners.com, zerohedge.com, ritholtz.com, markit.com, financialpost.com, Eurostat, Statistics Canada, Yahoo! Finance, stocksandnews.com, marketwatch.com, wantchinatimes.com, BBC, 361capital.com, pensionpartners.com, cnbc.com, FactSet.) Content provided by WE Sherman and Company. Securities offered through Registered Representatives of Cambridge Investment Research Inc., a broker-dealer, member FINRA/SIPC. Advisory Services offered through Cambridge Investment Research Advisors, a Registered Investment Adviser. Strategic Investment Partners and Cambridge are not affiliated. Indices mentioned are unmanaged and cannot be invested into directly. Past performance is no guarantee of future results. These opinions of Strategic Investment Partners and not necessarily those of Cambridge Investment Research, are for informational purposes only and should not be construed or acted upon as individualized investment advice.