
12-17-18 Weekly Market Update
The very big picture:
In the “decades” timeframe, the current Secular Bull Market could turn out to be among the shorter Secular Bull markets on record. This is because of the long-term valuation of the market which, after nine years, has reached the upper end of its normal range.
The long-term valuation of the market is commonly measured by the Cyclically Adjusted Price to Earnings ratio, or “CAPE”, which smooths out shorter-term earnings swings in order to get a longer-term assessment of market valuation. A CAPE level of 30 is considered to be the upper end of the normal range, and the level at which further PE-ratio expansion comes to a halt (meaning that increases in market prices only occur in a general response to earnings increases, instead of rising “just because”).
Of course, a “mania” could come along and drive prices higher – much higher, even – and for some years to come. Manias occur when valuation no longer seems to matter, and caution is thrown completely to the wind as buyers rush in to buy first and ask questions later. Two manias in the last century – the 1920’s “Roaring Twenties” and the 1990’s “Tech Bubble” – show that the sky is the limit when common sense is overcome by a blind desire to buy. But, of course, the piper must be paid and the following decade or two are spent in Secular Bear Markets, giving most or all of the mania gains back.
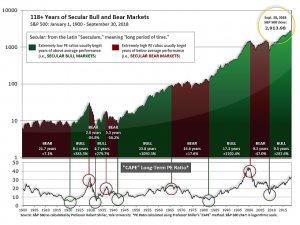
See Fig. 1 for the 100-year view of Secular Bulls and Bears. The CAPE is now at 28.78, down from the prior week’s 29.54, about the level reached at the pre-crash high in October, 2007. Since 1881, the average annual return for all ten year periods that began with a CAPE around this level have been in the 0% – 3%/yr. range. (see Fig. 2).

In the big picture:
The “big picture” is the months-to-years timeframe – the timeframe in which Cyclical Bulls and Bears operate. The U.S. Bull-Bear Indicator (see Fig. 3) is in Cyclical Bull territory at 50.28, down from the prior week’s 52.60.

In the intermediate and Shorter-term picture:
The Shorter-term (weeks to months) Indicator (see Fig. 4) turned positive on November 28th. The indicator ended the week at 5, down sharply from the prior week’s 13. Separately, the Intermediate-term Quarterly Trend Indicator – based on domestic and international stock trend status at the start of each quarter – was positive entering October, indicating positive prospects for equities in the fourth quarter of 2018.

Timeframe summary:
In the Secular (years to decades) timeframe (Figs. 1 & 2), the long-term valuation of the market is simply too high to sustain rip-roaring multi-year returns – but the market has entered the low end of the “mania” range, and all bets are off in a mania. The only thing certain in a mania is that it will end badly…someday. The Bull-Bear Indicator (months to years) is positive (Fig. 3), indicating a potential uptrend in the longer timeframe. In the intermediate timeframe, the Quarterly Trend Indicator (months to quarters) is positive for Q4, and the shorter (weeks to months) timeframe (Fig. 4) is positive. Therefore, with three indicators positive and none negative, the U.S. equity markets are rated as Positive.
In the markets:
U.S. Markets: The major U.S. indexes finished the week lower as a midweek rebound was retraced by a rout on Friday. The Dow Jones Industrial Average shed 288 points or -1.2% to end the week at 24,100. The technology-heavy NASDAQ Composite gave up -0.8% closing at 6,910. By market cap, small cap and mid cap stocks continued to bear the brunt of the selling with the small cap Russell 2000 index falling -2.6% and the mid cap S&P 400 index declining -2.7%. The large cap S&P 500 index fell just half the decline of small cap and mid cap, losing -1.3%.
International Markets: Canada’s TSX followed last week’s decline with a further -1.4%. Bucking the trend in North America major markets in Europe managed a positive close for the week. The United Kingdom’s FTSE rebounded 1%, while France’s CAC 40 and Germany’s DAX gained 0.8% and 0.7% respectively. In Asia, China’s Shanghai Composite ended the week down after last week’s gain, shedding -0.5%. Japan’s Nikkei fell a deeper -1.4%. As grouped by Morgan Stanley Capital International, developed markets retreated -0.5%, while emerging markets were off just -0.1%.
Commodities: Precious metals were unable to profit from the week’s volatility. Gold gave up -0.9% or $11.20 to end the week at $1241.40 an ounce. Likewise, Silver retreated -0.4% and ended the week at $14.64 an ounce. Energy retraced most of the last two weeks of gains as West Texas Intermediate crude oil retreated -2.7% to end the week at $51.20 per barrel. The industrial metal copper, viewed by many as a barometer of global market health due to its wide variety of uses, managed a slight gain, up 0.1% for the week.
U.S. Economic News: The number of Americans applying for new unemployment benefits plunged by 27,000 last week to 206,000. The decline in applications puts claims back to near a 50-year low. Economists had forecast a reading of 226,000. A few weeks ago, new claims had risen to an eight-month high of 235,000 raising questions about whether the labor market has cooled—this report suggests it perhaps it hasn’t. The more stable monthly average of new claims fell by 3,750 to 224,750. Continuing claims, which counts the number of people already receiving unemployment benefits, rose by 25,000 to 1.66 million. That number is also near its lowest levels since 1972.
Despite rising economic worries the number of job openings in the United States remained near a record high in October, the Labor Department reported. Job openings picked up 1.7% to 7.079 million. The reading signals that companies are still seeking to hire more workers to keep up with rising sales. Job openings first hit a record high of 7.3 million in August and have remained near that number since. Information and media, real estate, and education led the increase. The quits rate, rumored to be closely watched by the Federal Reserve presumably because one would only quit a job for a more lucrative one, fell a tick to 2.6% among private sector employees. It was the first decline in six months. The rate of people quitting had hit its highest level in 17 years toward the end of summer.
Sentiment among the nation’s small business owners hit a 7-month low last month according to the National Federation of Independent Business. The NFIB’s small-business optimism index fell 2.6 points to a seasonally-adjusted level of 104.8. Most of the decline came from lower expectations of future sales and business conditions. In the details, only two of the components remained flat (plans to increase employment and expected credit conditions) while the rest declined. Of note, a record number of respondents continued to voice that a scarcity of “qualified” workers remained their top business concern. In addition, more than a third reported having job openings they could not fill. Reflecting the tight labor market, a net 25% of firms (the highest share since December of 1989) plan to raise worker compensation in the next three months.
Sales at the nation’s retailers rose 0.2% in November beating expectations of a 0.1% gain, the Commerce Department reported. In addition, the previous month’s solid gain of 0.8% was revised even higher to 1.1%. Most major categories increased, with online sales surging 2.3%–the most in a year. Furniture, electronics, and appliances also showed strong increases in sales. Auto sales, which make up about one-fifth of all retail sales, edged up 0.2%. Year-over-year retail sales rose 4.3%, down from 5.1% the prior month. The report is consistent with a stronger 4th quarter GDP print than currently expected. Chief economist Joshua Shapiro of MFR Inc. stated, “Today’s report appears to point toward somewhat faster growth in the fourth quarter than we have been forecasting.”
Prices at the wholesale level rose only slightly in November, edging up 0.1% last month, contrary to the consensus forecast for a 0.1% decline. Ex-food and energy components, the Producer Price Index (PPI) climbed a larger 0.3%. Year-over-year, PPI for final demand eased to 2.6% – its slowest pace of the year – largely due to the continued weakness in energy prices. Of note, some economists think inflation will increase next year. U.S. tariffs have raised the cost of consumer goods and key raw materials (for example, the wholesale cost of scrap steel jumped almost 10% just in November). Furthermore, the shortage of skilled labor has forced companies to boost pay. Stephen Stanley, chief economist at Amherst Pierpont Securities stated, “Underlying inflation is more likely to head up than down in 2019, though in the short run, the plunge in energy prices will keep headline inflation under wraps.”
The Consumer Price Index (CPI) remained level in November, primarily due to cheaper gas. Energy prices fell 2.2% in November, but food prices ticked up 0.2%. Core CPI, which excludes the often-volatile food and energy categories, rose 0.2%, matching consensus expectations. On an annualized basis, core CPI rose to 2.2% — above the Federal Reserve’s target for inflation. Analysts noted that there was nothing in this report to dissuade the Fed from raising the fed funds target rate next week. Year-over-year, CPI eased 0.3% to 2.2%, near its lowest level of the year. Prices for shelter increased 3.2% year-over-year, led by higher rents. Ex-shelter core CPI was up 1.5% year-over-year, indicating that other core components besides shelter were also rising.
International Economic News: Statistics Canada reported that a key debt ratio, the amount Canadians owe relative to their income, ticked higher in the third quarter. On a seasonally-adjusted basis, household credit debt as a proportion of disposable income was 177.5% last quarter, up 0.1% from the second quarter. Put simply, Canadians owed nearly $1.78 in credit debt for every dollar of household disposable income. An economic analyst at BMO Capital Markets, Priscilla Thiagamoorthy, stated the report showed an “unexpected deterioration” in the health of Canadian household balance sheets. “But unlike in past quarters, the culprit is a weaker income backdrop rather than higher debt loads,” Thiagamoorthy wrote in research note. Household debt has been a key concern for the Canadian economy. The Bank of Canada has been watching to see how well households have been adapting to higher borrowing costs while it has been raising rates.
Across the Atlantic, Switzerland appears to have defied globalist pressures by agreeing to a trade accord with a post-Brexit Britain. The Swiss government said it had approved the text of a trade agreement with Britain, aiming to maintain existing economic and trade relations with the United Kingdom after it leaves the European Union. Furthermore, the Swiss cabinet (known as the Federal Council) noted that it would abide by the agreement even in the event of a “no-deal Brexit” between Britain and the EU. “This agreement guarantees, as far as possible, the continuation of the economic and commercial rights and obligations arising from the agreements between Switzerland and the EU, and provides for exploratory discussions aimed at developing these bilateral relations in the future,” the government said. In 2017, the UK was Switzerland’s sixth largest export market valued at 11.4 billion Swiss francs (11.44 billion U.S. dollars) and its eighth largest supplier with imports worth 6.1 billion Swiss francs.
The private sector in France contracted this month for the first time under Macron’s presidency, research firm IHS Markit reported. Markit’s Purchasing Managers’ Index (PMI) for France was down sharply in December at 49.3, from November’s reading of 54.2. Readings below 50 indicate economic contraction, rather than growth. The reading confounded analysts, with the index hitting a level not seen since November 2014. According to Eliot Kerr, an economist at Markit, a main catalyst for the deterioration was likely the “yellow vest” demonstrations in France. Protestors wearing the bright yellow safety vests that French law mandates every motorist carry have been protesting French President Emmanuel Macron’s imposition of a steep so-called “carbon tax” on fuel intended to fight global warming by reducing fossil fuel consumption. After the revolt of the yellow vests, though, Macron backed down and scrapped the tax.
Germany’s Economy Minister Peter Altmaier acknowledged he expects a slowdown in growth of the German economy but remained confident it would remain in expansion. Altmaier reduced his growth forecast for the year to the range of 1.5% to 1.6%, below his previous forecast of 1.8%. Analysts suggest that the downturn is most likely due to the ongoing trade dispute between the U.S. and China and political uncertainty surrounding Britain’s exit from the European Union. Altmaier went on to say that Germany will have its 10th year of expansion in 2019 and opined that the rise of populism was the biggest risk in Europe, pointing to the violent street protests in France.
Chinese officials reported “surprisingly weak” growth in monthly retail sales and industrial production this week. China’s retail sales for November grew at their weakest pace in 15 years, while industrial production rose the least in almost three years as domestic demand continued to wane. The slowdown among China’s industries has started to weigh on consumer sentiment this year leading to a drop in retail sales. In addition, China reported far weaker than expected exports and imports last month, reflecting slower global demand and slowing domestic factory activity.
The same week that Japan’s current economic expansion was confirmed as its second-longest since World War 2, a key quarterly economic survey from the Bank of Japan showed sentiment among large manufacturers remained flat as concerns about global trade tensions persisted. The “Tankan” survey, which has long been viewed as an important indicator of the state of the world’s third largest economy, showed sentiment remained flat at a reading of 19 for a second time after three quarters of declines. In addition, the survey projected sentiment will drop by four points to 15 over the next three months. Still, some analysts viewed the report as a positive after the economy contracted at a 2.5% annual rate in the third quarter. In his commentary, Marcel Theliant of Capital Economics had an even more optimistic view noting, “The Q4 Tankan survey was better than most had anticipated and adds to the evidence that the economy has turned the corner.”
Finally: The French “gilets jaunes” (yellow vest) protestors who burned Paris last week evidently are unhappy about more than just gas prices. Office furniture maker Steelcase published a survey noting that France has the lowest proportion of workers who are happy with their environment. Just 5% of French workers surveyed said they were “highly engaged and satisfied” with their companies and workplaces – far below the global average of 13%. On the other hand, workers in India had the highest proportion of happy workers at 28%. The United States, with 14% happy workers, comes in slightly above the global average of 13%.

(sources: all index return data from Yahoo Finance; Reuters, Barron’s, Wall St Journal, Bloomberg.com, ft.com, guggenheimpartners.com, zerohedge.com, ritholtz.com, markit.com, financialpost.com, Eurostat, Statistics Canada, Yahoo! Finance, stocksandnews.com, marketwatch.com, wantchinatimes.com, BBC, 361capital.com, pensionpartners.com, cnbc.com, FactSet) These are the opinions of WE Sherman and Co and not necessarily those of Cambridge, are for informational purposes only, and should not be construed or acted upon as individualized investment advice.
Securities offered through Registered Representatives of Cambridge Investment Research Inc., a broker-dealer, member FINRA/SIPC. Advisory Services offered through Cambridge Investment Research Advisors, a Registered Investment Adviser. Strategic Investment Partners and Cambridge are not affiliated.
Indices mentioned are unmanaged and cannot be invested into directly. Past performance is no guarantee of future results. All Investing involves risk. Depending on the types of investments, there may be varying degrees of risk. Investors should be prepared to bear loss, including total loss of principal.