
11-25-19 Weekly Market Update
The Very Big Picture:
The long-term valuation of the market is commonly measured by the Cyclically Adjusted Price to Earnings ratio, or “CAPE”, which smooths out shorter-term earnings swings in order to get a longer-term assessment of market valuation. A CAPE level of 30 is considered to be the upper end of the normal range, and the level at which further PE-ratio expansion comes to a halt (meaning that increases in market prices only occur in a general response to earnings increases, instead of rising “just because”). The market is currently at that level.
Of course, a “mania” could come along and drive prices higher – much higher, even – and for some years to come. Manias occur when valuation no longer seems to matter, and caution is thrown completely to the wind as buyers rush in to buy first and ask questions later. Two manias in the last century – the 1920’s “Roaring Twenties” and the 1990’s “Tech Bubble” – show that the sky is the limit when common sense is overcome by a blind desire to buy. But, of course, the piper must be paid and the following decade or two are spent in Secular Bear Markets, giving most or all of the mania gains back.
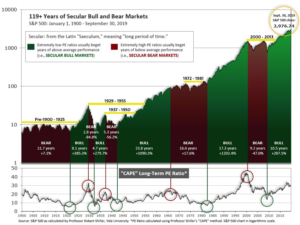
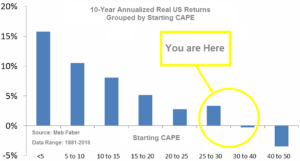
See Fig. 1 for the 100-year view of Secular Bulls and Bears. The CAPE is now at 30.24, down from the prior week’s 30.34, above the level reached at the pre-crash high in October, 2007. Since 1881, the average annual return for all ten year periods that began with a CAPE around this level have been in the 0% – 3%/yr. range. (see Fig. 2).
In the Big Picture:
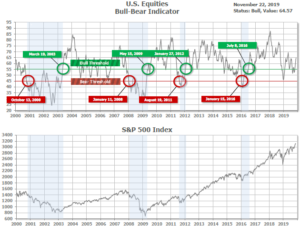
The “big picture” is the months-to-years timeframe – the timeframe in which Cyclical Bulls and Bears operate. The U.S. Bull-Bear Indicator (see Fig. 3) is in Cyclical Bull territory at 64.57, up from the prior week’s 63.76.
In the Intermediate and Shorter-term Picture:
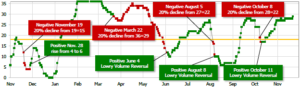
The Shorter-term (weeks to months) Indicator (see Fig. 4) is positive. The indicator ended the week at 29, up from the prior week’s 28. Separately, the Intermediate-term Quarterly Trend Indicator – based on domestic and international stock trend status at the start of each quarter – was positive entering October, indicating positive prospects for equities in the fourth quarter of 2019.
Timeframe Summary:
In the Secular (years to decades) timeframe (Figs. 1 & 2), the long-term valuation of the market is historically too high to sustain rip-roaring multi-year returns. The Bull-Bear Indicator (months to years) remains positive (Fig. 3), indicating a potential uptrend in the longer timeframe. In the intermediate timeframe, the Quarterly Trend Indicator (months to quarters) is positive for Q4, and the shorter (weeks to months) timeframe (Fig. 4) is positive. Therefore, with three indicators positive and none negative, the U.S. equity markets are rated as Positive.
In the Markets:
U.S. Markets: The major U.S. stock indexes ended their streak of weekly gains at six and moved modestly lower as trade concerns returned to the forefront. Benchmarks traded in a narrow band until turning lower midweek as negative developments in the U.S.-China trade dispute hit news wires. The Dow Jones Industrial Average gave up 129 points last week to close at 27,875 a decline of -0.5%. The technology-heavy NASDAQ Composite retreated ‑0.3%. By market cap, the large cap S&P 500 declined -0.3%, while the mid cap S&P 400 and small cap Russell 2000 retreated -0.7% and -0.5%, respectively.
International Markets: Like the U.S., most international markets finished in the red as well. Canada’s TSX fell ‑0.4%, while the United Kingdom’s FTSE 100 finished the week up 0.3%. On Europe’s mainland, France’s CAC 40 declined -0.8%, Germany’s DAX fell -0.6%, and Italy’s Milan FTSE gave up -1.4%. In Asia, China’s Shanghai Composite finished down -0.2% and Japan’s Nikkei declined -0.8%. As grouped by Morgan Stanley Capital International, developed markets retreated -0.5%, while emerging markets fell -0.6%.
Commodities: Precious metals ended the week mixed with Gold giving up -0.3% and closing at $1463.60 an ounce, while Silver rose 0.3% to $17.00. Oil just barely managed its third consecutive week of gains, rising 0.1% to $57.77 per barrel of West Texas Intermediate crude. The industrial metal copper, viewed by analysts as a barometer of world economic health due to its myriad of uses, rose 0.4% last week.
U.S. Economic News: The number of Americans seeking first-time unemployment benefits remained near a 5‑month high last week, the Labor Department reported. Initial jobless claims remained flat at 227,000, exceeding economists’ forecasts for just 218,000 new claims. The current level of claims remains at its highest level since last June. The monthly average of new claims, smoothed to iron out the weekly volatility, rose by 3,500 to 221,000. The number of people already collecting unemployment benefits, known as continuing claims, increased by 3,000 to 1.69 million. Those claims remain near their lowest level since the early 1970’s.
Sales of existing homes rebounded last month as low mortgage rates continued to provide a lift. The National Association of Realtors (NAR) reported sales of previously-owned homes rose 1.9% in October to a 5.46 million seasonally-adjusted annual pace. Year-over-year sales are up 4.6%. The reading barely missed economists’ forecast of an increase to 5.47 million sales. Prices increased across all regions of the country, and the median sales price ticked up 6.2% over the past year to $270,900. The number of months’ supply of new homes ticked down to just 3.9, said the NAR, far below the 6 months generally considered to indicate a “balanced” housing market.
Home builders are still quite optimistic about the future of the housing market, but the current state of the economy is weighing on sentiment. The National Association of Home Builders’ (NAHB) monthly confidence index declined one point to 70 this month. The reading is just off the 20-month high set in October. Despite the slight decline, index readings over 50 still represent improvement. Overall, home builders have continued to grow more confident throughout the year, and the NAHB said it was largely due to the more favorable interest rate environment that emerged in late summer.
Builders broke ground on new homes at a pace of 1.314 million last month, the Commerce Department reported. The reading was just short of the consensus forecast for 1.325 million starts among economists. In percentage terms, starts were up 3.8% from September and 8.5% higher than from the same time last year. Of note, building permits for privately-owned housing units were at a 1.461 million pace. That was 5% above September’s reading, and up 14.1% from last year. September’s reading was the fastest rate of building-permit authorizations recorded since 2007. Furthermore, October’s reading was the second best month for housing starts so far this year. Analysts attribute the optimism among builders to multiple factors including lower mortgage rates and an easing of tensions in the trade war between the U.S. and China.
The University of Michigan (UofM) reported that sentiment among the nation’s consumers rose in November. UofM’s reading of its consumer-sentiment index was 96.8, 1.3 points above October’s reading. Economists had estimated the reading would remain unchanged at 95.7. In the details of the report, consumers’ views on current conditions declined to 111.6 in November from 113.2 in October, while the measure of their expectations for the future rose 3.1 points to 87.3. Many economists and Federal Reserve officials think the U.S. economy can avoid a recession because of the strong consumer sector. The holiday shopping season will be a good test for this thesis.
Manufacturing activity in the mid-Atlantic region improved this month according to data from the Federal Reserve Bank of Philadelphia. The Philly Fed’s manufacturing index rose 5 points in November to 10.4, but analysts noted some of the details remained soft. While firms were generally optimistic about the future, the indicators for new orders, shipments and employment all fell from their readings last month, while the index of future activity rose 2 points to 35.8.
Research firm IHS Markit reported both its flash manufacturing and services Purchasing Managers’ Indexes (PMI) improved this month. For the manufacturing sector, Markit reported its index rose 0.9 point to 52.5 in November—its fastest gain since April. Meanwhile, its flash services sector PMI index rose to 51.6 from 50.6. That was that reading’s fastest increase since July. Chris Williamson, chief business economist at IHS Markit stated, “A welcome upturn in the headline index from the flash PMI adds to evidence that the worst of the economy’s recent soft patch may be behind us.” Markit’s flash estimates are typically based on approximately 85‑90% of total survey responses each month, with the final number coming out later.
Federal Reserve officials were more upbeat about the state of the economy in late October than they were just six weeks earlier, according to minutes from the Federal Reserve’s latest policy meeting. The minutes stated officials “generally viewed the economic outlook as positive” and that “Uncertainties associated with trade tensions as well as geopolitical risks had eased somewhat, although they remained elevated.” Officials also referred to the economy as “resilient” in the face of multiple headwinds. At their meeting, the Fed voted 8 to 2 to trim rates by a quarter point. It was the third straight meeting with a rate cut bringing the benchmark fed funds rate to a range of 1.5-1.75%. The minutes stress that the Fed would be watching the data closely and policy was not on a pre-set course. Powell told Congress last week that “if developments emerge that cause a material reassessment of our outlook, we would respond accordingly.”
International Economic News: The Bank of Canada opined that Canada is in a “good position” to weather a possible economic storm, a top official said this week. Senior Deputy Carolyn Wilkins said the central bank is not forecasting a recession at home or globally, but reiterated the global economy is facing immense challenges that could spill over into Canada. Wilkins told a business audience in Montreal, “In the unlikely event of a storm, Canada’s financial system is resilient and we are in a good position to deal with whatever comes our way.” For more than a year, while several of its counterparts in the U.S. and Europe have eased, the Bank of Canada has sat firmly on the sidelines. Last month, the BofC held its key interest rate steady at 1.75% as expected, but left the door open to a possible cut over the coming months.
Across the Atlantic the number of properties put up for sale in the United Kingdom fell by the most in any month in more than 10 years as the combination of an unresolved Brexit and an upcoming election weighed on the market. Property website Rightmove reported there were 14.9% fewer properties put up for sale in the four weeks to November 9th than in the same period last year. The reading was the biggest decline on an annualized basis since August 2009, shortly after the global financial crisis. “I’ve seen lots of unusual events affecting the property market in my 40-year career, but a Brexit deadline followed by a snap general election six weeks later is obviously a new combination,” said Miles Shipside, Rightmove director. Rightmove said some potential property sellers might be waiting to see if Britain’s next government reforms the stamp duty tax on property transactions which reduce the cost of buying a new home.
The European Commission told the French government that it had failed to address its mountains of debt despite the good economic conditions and that it is “not expected” to meet the European Union’s debt reduction targets. Valdis Dombrovskis, commissioner responsible for the Eurozone stated with regards to France, “They plan either no meaningful fiscal adjustments or even a fiscal expansion. This is worrying because very high debt levels limit the capacity to respond to economic shocks and market pressures.” France is forecast to be the only Eurozone country in breach of the EU’s deficit ceiling of three percent of GDP this year. Finance minister Bruno Le Maire has defended his draft budget, however, which simultaneously cuts taxes and raises spending.
A leading economic think-tank has warned the economic downturn in Germany will continue for at least the next two years due to its “export-dependent economy”. The Organization for Economic Cooperation and Development (OECD) has forecast the Germany economy will grow by less than 1% by 2021—lower than Germany’s official government projection. In its 3rd quarter review, the Paris-based OECD highlighted the “weakness” in Germany’s manufacturing industry and warned it will “rub off on the rest of the economy.” The OECD expects Germany’s economy to grow just 0.4% in 2020 and 0.9% in 2021.
In Asia, China’s central bank lowered its lending benchmark in an effort to lower the country’s funding costs and support its economy, which has been hurt by slowing global demand and its trade conflict with the United States. The People’s Bank of China (PBoC) cut its benchmark one-year Loan Prime Rate (LPLR) by 5 basis points to 4.15%. The five-year LPR was also lowered by the same margin to 4.80% from 4.85%. The LPR cuts are the latest in a series of reductions in interest rates as China tries to push commercial banks to lend to more small- and medium-sized businesses. Despite the cuts, analysts don’t think easing by the PBoC will be over anytime soon. Martin Lynge Rasmussen, China economist at Capital Economics stated in a research note, “With the prop from recent monetary easing likely to be underwhelming and headwinds to economic growth mounting, we think the PBOC will start to cut rates more aggressively in the coming months.”
Japan’s factory activity slowed for a seventh consecutive month in November as both domestic and export demand remained soft. Jibun Bank’s flash Japan Manufacturing Purchasing Managers’ Index (PMI) ticked up to a seasonally-adjusted 48.6 from 48.4 the previous month. Despite the improvement, the index remained below the 50.0 threshold that separates contraction from expansion. If the final reading (due early next month) confirms the contraction, it will make the longest stretch of contraction since 2012. Joe Hayes, economist at IHS Markit, which compiles the survey stated, “Slack in export demand, the protracted U.S.-China trade war and limited policy levers stack up against the chances of an improvement in Japan’s economy. Without any drive from the service sector, a quarterly contraction in Q4 seems highly likely.”
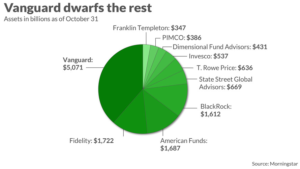
Finally: Once a lowly underdog in the mutual fund space, investment company Vanguard has become a behemoth with over 30 million investors led by an army of “bogleheads” (investing enthusiasts and disciples of Vanguard founder and investor advocate John Bogle). The sheer magnitude of the lead that Vanguard has amassed over its competitors has been documented by research provider Morningstar in a new report. Morningstar points out in its executive summary that Vanguard’s market share is greater than that of its next three biggest competitors combined (that’s for both mutual fund and exchange-traded funds). Furthermore, Vanguard’s lead continues to expand. Over the past year, Vanguard has attracted nearly half of all mutual fund and ETF inflows.
(Sources: all index return data from Yahoo Finance; Reuters, Barron’s, Wall St Journal, Bloomberg.com, ft.com, guggenheimpartners.com, zerohedge.com, ritholtz.com, markit.com, financialpost.com, Eurostat, Statistics Canada, Yahoo! Finance, stocksandnews.com, marketwatch.com, wantchinatimes.com, BBC, 361capital.com, pensionpartners.com, cnbc.com, FactSet) Securities offered through Registered Representatives of Cambridge Investment Research Inc., a broker-dealer, member FINRA/SIPC. Advisory Services offered through Cambridge Investment Research Advisors, a Registered Investment Adviser. Strategic Investment Partners and Cambridge are not affiliated.
Indices mentioned are unmanaged and cannot be invested into directly. Past performance is no guarantee of future results. All Investing involves risk. Depending on the types of investments, there may be varying degrees of risk. Investors should be prepared to bear loss, including total loss of principal.