
11-20-2023 Weekly Market Update
The very Big Picture
The long-term valuation of the market is commonly measured by the Cyclically Adjusted Price to Earnings ratio, or “CAPE”, which smooths-out shorter-term earnings swings in order to get a longer-term assessment of market valuation. A CAPE level of 30 is considered to be the upper end of the normal range, and the level at which further PE-ratio expansion comes to a halt (meaning that further increases in market prices only occur as a general response to earnings increases, instead of rising “just because”). The market was recently above that level and has fallen back.
Of course, a “mania” could come along and drive prices higher – much higher, even – and for some years to come. Manias occur when valuation no longer seems to matter, and caution is thrown completely to the wind – as buyers rush in to buy first, and ask questions later. Two manias in the last century – the “Roaring Twenties” of the 1920s, and the “Tech Bubble” of the late 1990s – show that the sky is the limit when common sense is overcome by a blind desire to buy. But, of course, the piper must be paid, and the following decade or two were spent in Secular Bear Markets, giving most or all of the mania-gains back.
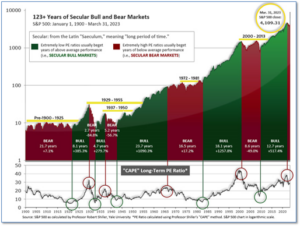
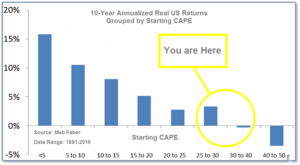
See Fig. 1 for the 100-year view of Secular Bulls and Bears. The CAPE is now at 30.56, up from the prior week’s 29.89. Since 1881, the average annual return for all ten-year periods that began with a CAPE in this range has been slightly positive to slightly negative (see Fig. 2).
Note: We do not use CAPE as an official input into our methods. However, if history is any guide – and history is typically ‘some’ kind of guide – it’s always good to simply know where we are on the historic continuum, where that may lead, and what sort of expectations one may wish to hold in order to craft an investment strategy that works in any market ‘season’ … whether the current one, or one that may be ‘coming soon’!
The Big Picture:
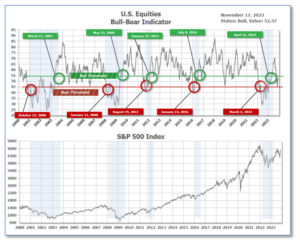
The ‘big picture’ is the (typically) years-long timeframe – the timeframe in which Cyclical Bulls and Bears operate. The U.S. Bull-Bear Indicator finished the week in Bull territory at 52.57 up from the prior week’s 50.01. (see Fig. 3)
In the Quarterly- and Shorter-term Pictures
The Quarterly-Trend Indicator based on the combination of U.S. and International Equities trend-statuses at the start of each quarter – was Positive entering July, indicating positive prospects for equities in the third quarter.
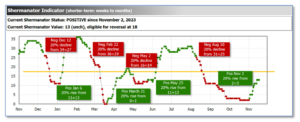
Next, the short-term(weeks to months) Indicator for US Equities turned positive on November 2, and ended the week at 13, up 2 from the prior week.
In the Markets:
U.S. Markets: The major indexes finished the week in the green. The S&P 500 Index built upon its two weeks of strong gains and crossed the 4,500 barrier for the first time since September. The small-cap indexes advanced as well. The Dow Jones Industrial Average rose 664 points finishing the week at 34,947—an increase of 1.9%. The technology-heavy NASDAQ gained 2.4%. By market cap, the large cap S&P 500 added 2.2%, while the mid cap S&P 400 advanced 4.0%. The small cap Russell 2000 performed the best, finishing the week at 5.4%.
International Markets: International indexes finished the week in the green as well. Canada’s TSX climbed 2.7%, while the UK’s FTSE 100 ticked up 2.0%. France’s CAC 40 gained 2.7%, while Germany’s DAX advanced 4.5%. In Asia, China’s Shanghai Composite added 0.5%. Japan’s Nikkei finished the week up 3.1%. As grouped by Morgan Stanley Capital International, developed markets gained 4.0%. Emerging markets climbed 2.6%.
Commodities: Precious metals also advanced this week. Gold increased by 2.43% to $1984.70 an ounce and Silver gained 7.05% to $23.85. The industrial metal copper, viewed by some analysts as a barometer of world economic health due to its wide variety of uses, grew 4.22%. West Texas Intermediate crude oil pulled back for a fourth consecutive week giving up -1.46% to $76.04 per barrel.
U.S. Economic News:
Inflation flattened in October, thanks to cheaper gas, CPI data showed. Over twelve months, the rate of inflation has slowed from 3.7% to 3.2%. The cost of gasoline dropped 5.3% in October, which helped steady the CPI reading. Meanwhile, the core consumer-price index, which excludes food and energy prices, rose a mild 0.2% last month. The slowed inflation level could incline the Fed to hold interest rates steady at its last meeting of the year. “October’s report had good news for both winning the long-term inflation fight and easing some short-term pain,” corporate economist Robert Frick of Navy Federal Credit Union said. “October is just one fight in a long war against inflation, but we can count it as a victory,” Frick added.
At the wholesale level, the U.S. producer price index dropped 0.5% in October, the Labor Department reported. The core producer price index, which omits food, energy prices, and trade services, increased 0.1% last month. Energy prices fell 6.5% in October, while wholesale food prices shed 0.2% after a 0.7% rise in the prior month. For the first time in six months, the cost of services was flat. Through 2023, headline PPI advanced 1.3% in October, which was below September’s 2.2%. Core prices have increased 2.9% from 2022. According to the chief international economist at ING, James Knightley, the report “feeds the soft-landing narrative with subdued price pressures and resilience in activity.”
Retail sales fell 0.1% nationwide last month, but the decline is unlikely to last through the holiday season. While higher borrowing costs and prices continue to squeeze the budgets of households, economists still expect sales to increase by about 4% during the holiday shopping season. Retail sales account for about one-third of consumer spending. Sales at internet retailers, bars, and restaurants rose slightly, which suggests consumers have discretionary income to spend towards wants instead of needs. “Following last month’s large increase, the consumer has now returned to a more manageable level of spending, cutting back ahead of an important holiday season,” said Damian McIntyre, portfolio manager and head of multi-asset solutions at Federated Hermes.
Jobless claims climbed to a three-month high of 231,000 last week. The number of actual claims, before seasonal adjustments, reached 200,000 for the second consecutive week and marked a three-month high. The number of people collecting unemployment benefits rose for the eighth week in a row to 1.83 million. Claims remained at relatively low levels, indicating some stability in the economy, but businesses have been hiring less rapidly and the labor market seems to have cooled off a bit. “Initial jobless claims are still at levels consistent with relatively few layoffs, but they are creeping higher,” said Nancy Vanden Houten, lead U.S. economist of Oxford Economics.
The builder-confidence index fell for the fourth month in a row in November. The National Association of Home Builders’ (NAHB) monthly confidence index fell 6 points to 34, which marked its lowest level since December of 2022. Economists had expected sentiment to hold steady. The NAHB recently forecasted a 5% increase in single-family starts in 2024 as “financial conditions ease with improving inflation data in the months ahead.” Meanwhile, as rates approached 8%, builders increased sales incentives to retain prospective buyers. The NAHB reported the share of builders cutting prices rose from 32% to 36%. The average price cut was 6%. All three gauges within the builder-confidence index fell this month. Builders were pessimistic about sales conditions, were downbeat on future sales, and builders saw a drop in the traffic of prospective buyers. “While builder sentiment was down again in November, recent macroeconomic data point to improving conditions for home construction in the coming months,” Robert Dietz, chief economist at the NAHB, said.
International Economic News: Economic freedoms in Canada have hit a new low, the Fraser Institute reported. Through the course of this year, Canadians’ freedom regarding purchases, work, and entrepreneurship weakened. Once a year, the Fraser’s Institute assesses how much freedom people have about what to buy, where to work, and whether to start a business. In their 2023 assessment, all Canadian provinces plunged to the bottom half of the rankings for the first time. Nova Scotia, Prince Edward Island, New Brunswick, Newfoundland, and Labrador, have the lowest levels of economic freedom among Canada’s provinces. “The trajectory of economic freedom in Canada could lead to weakness in economic growth and prosperity in the years ahead,” said Fred McMahon, Research Chair in Economic Freedom at the Fraser Institute. “Higher levels of economic freedom lead to more opportunity and more prosperity, so as economic freedom wanes the prospects also diminish for Canadians and their families,” McMahon added.
Across the Atlantic, UK wage growth cooled slightly. After rising at a record pace, wages in Britain slowed, according to official data from the Office for National Statistics. Earnings, excluding bonuses, were 7.7% higher in the third quarter from the prior year, which was in line with economists’ estimates. The Bank of England’s long run of interest rate hikes had squeezed households and businesses, but employers are still eager to fill job vacancies left over from the pandemic. Britain’s unemployment rate held at 4.2%, according to the ONS. Employment rose by 54,000 in the third quarter. James Smith, an economist with ING, said pay pressures were on the right trajectory, and with further progress, could lead to the BoE making its first rate cut next year. “All of that suggests the BoE’s forecast for private-sector wage growth to hit 6.6% in March appears to be on track, and if anything, might be beaten on the downside,” Smith added.
On Europe’s mainland, the euro zone’s economy contracted marginally in the third quarter, but employment increased. The European Union’s statistics office, Eurostat, reported that the twenty countries sharing the euro fell 0.1% quarter-on-quarter. After business activity data for last month showed demand weakened in the dominant services industry, the European Central Bank vice president, Luis De Guindos, said the euro zone economy was likely to contract slightly or stagnate in the fourth quarter. Meanwhile, employment in the euro zone rose 0.3% quarter-on-quarter. According to Eurostat data, France had 0.1% economic growth, 0.3% in Spain, 0.5% in Belgium. However, Germany had a 0.1% quarterly slump, no growth in Italy, and contractions in Austria, Portugal, Ireland, Estonia, and Lithuania. De Guindos said that the institution would continue to follow a data-dependent approach regarding its future monetary policy.
China’s industrial output and retail sales growth surpassed expectations in October, but weakness in the property sector continued to forestall economic revival. China’s industrial output grew 4.6% year-on-year in October, data from the National Bureau of Statistics (NBS) reported. Economists had estimated a 4.4% increase. Retail sales rose 7.6% last month with improvement in auto and restaurant sales growth. However, economists are concerned about longer term economic revival. “Due to the impact of holidays and low base effect in 2022, year-on-year figures cannot reflect the actual momentum of the economy,” said Xing Zhaopeng, senior China strategist at ANZ. Louise Loo, China economist at Oxford Economics, said prolonged weakness in external demand could weigh down industrial production despite last month’s decrease in destocking pressures. “Overall, the data published today suggest that the recovery was struggling to gain a strong footing at the start of Q4, but it was not nearly as weak as some had feared,” said Sheana Yue, China economist at Capital Economics.
Japan’s economy contracted in the third quarter, which ended two straight quarters of expansion on softened consumption and exports. Gross domestic product (GDP) in Japan contracted 2.1%, government data showed. It followed an expansion of 4.5% in the previous quarter. The data suggested that high inflation has taken a toll on household spending and added to the pains manufacturers are already feeling from slowed global demand, including demand in China. “Given the absence of a growth engine, it wouldn’t surprise me if the Japanese economy contracted again in the current quarter. The risk of Japan falling into recession cannot be ruled out,” said Takeshi Minami, chief economist at Norinchukin Research Institute. Minami added, “The weak growth and the specter of slowing inflation could delay the BOJ’s exit from negative interest rates.”
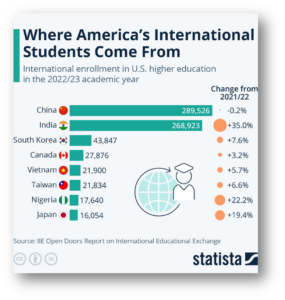
Finally: Enrollment at U.S. higher education institutes plummeted during the pandemic, but the number of international students bounced back this year, primarily due to an influx from India. 1.06 million international students came to the U.S. this school year, according to the Open Doors Report on International Education Exchange. Katharina Buchholz of Statista said that international students make up 5.6% of the total U.S. student population and contributed approximately $40 billion to the American economy between 2022 to 2023. China is the largest source country for international students enrolled in U.S. education institutes with 289,526 in undergraduate, graduate, and non-degree training programs. India came in second with 268,923 students. South Korea is ranked third with 43,847 international students in the past academic year, tailed by Canada, Vietnam, and Taiwan. Nigeria and Japan are quickly growing in their international enrollment at U.S. institutions at 22% and 19% respectively.
(Sources: All index- and returns-data from Norgate Data and Commodity Systems Incorporated; news from Reuters, Barron’s, Wall St. Journal, Bloomberg.com, ft.com, guggenheimpartners.com, zerohedge.com, ritholtz.com, markit.com, financialpost.com, Eurostat, Statistics Canada, Yahoo! Finance, stocksandnews.com, marketwatch.com, wantchinatimes.com, BBC, 361capital.com, pensionpartners.com, cnbc.com, FactSet.) Content provided by WE Sherman and Company. Securities offered through Registered Representatives of Cambridge Investment Research Inc., a broker-dealer, member FINRA/SIPC. Advisory Services offered through Cambridge Investment Research Advisors, a Registered Investment Adviser. Strategic Investment Partners and Cambridge are not affiliated. Indices mentioned are unmanaged and cannot be invested into directly. Past performance is no guarantee of future results. These opinions of Strategic Investment Partners and not necessarily those of Cambridge Investment Research, are for informational purposes only and should not be construed or acted upon as individualized investment advice.