
11-19-18 Weekly Market Update
The very big picture:
In the “decades” timeframe, the current Secular Bull Market could turn out to be among the shorter Secular Bull markets on record. This is because of the long-term valuation of the market which, after nine years, has reached the upper end of its normal range.
The long-term valuation of the market is commonly measured by the Cyclically Adjusted Price to Earnings ratio, or “CAPE”, which smooths out shorter-term earnings swings in order to get a longer-term assessment of market valuation. A CAPE level of 30 is considered to be the upper end of the normal range, and the level at which further PE-ratio expansion comes to a halt (meaning that increases in market prices only occur in a general response to earnings increases, instead of rising “just because”).
Of course, a “mania” could come along and drive prices higher – much higher, even – and for some years to come. Manias occur when valuation no longer seems to matter, and caution is thrown completely to the wind as buyers rush in to buy first and ask questions later. Two manias in the last century – the 1920’s “Roaring Twenties” and the 1990’s “Tech Bubble” – show that the sky is the limit when common sense is overcome by a blind desire to buy. But, of course, the piper must be paid and the following decade or two are spent in Secular Bear Markets, giving most or all of the mania gains back.
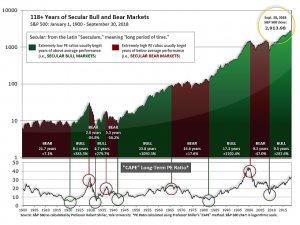
See Fig. 1 for the 100-year view of Secular Bulls and Bears. The CAPE is now at 30.72, down from the prior week’s 31.27, and exceeds the level reached at the pre-crash high in October, 2007. This value is in the lower end of the “mania” range. Since 1881, the average annual return for all ten year periods that began with a CAPE around this level have been in the 0% – 3%/yr. range. (see Fig. 2).

In the big picture:
The “big picture” is the months-to-years timeframe – the timeframe in which Cyclical Bulls and Bears operate. The U.S. Bull-Bear Indicator (see Fig. 3) is in Cyclical Bull territory at 57.00, down from the prior week’s 58.35.

In the intermediate and Shorter-term picture:
The Shorter-term (weeks to months) Indicator (see Fig. 4) turned positive on October 16th. The indicator ended the week at 16, down from the prior week’s 19. Separately, the Intermediate-term Quarterly Trend Indicator – based on domestic and international stock trend status at the start of each quarter – was positive entering October, indicating positive prospects for equities in the fourth quarter of 2018.

Timeframe summary:
In the Secular (years to decades) timeframe (Figs. 1 & 2), the long-term valuation of the market is simply too high to sustain rip-roaring multi-year returns – but the market has entered the low end of the “mania” range, and all bets are off in a mania. The only thing certain in a mania is that it will end badly…someday. The Bull-Bear Indicator (months to years) is positive (Fig. 3), indicating a potential uptrend in the longer timeframe. In the intermediate timeframe, the Quarterly Trend Indicator (months to quarters) is positive for Q4, and the shorter (weeks to months) timeframe (Fig. 4) is positive. Therefore, with three indicators positive and none negative, the U.S. equity markets are rated as Positive.
In the markets:
U.S. Markets: U.S. stocks fell for the week, starting with a plunge on Monday that saw the S&P 500 record its worst decline in a month. That was followed by a further decline on Wednesday, but indexes remained above their recent lows established in late October. The Dow Jones Industrial Average reversed most of the prior week’s gain by shedding 576 points, or -2.2%, to close at 25,413. The technology-heavy NASDAQ Composite also gave up ‑2.2%, closing at 7,247. By market cap, the large cap S&P 500 fell -1.6%, the mid cap S&P 400 gave up -0.9%, and the small cap Russell 2000 lost -1.4%.
International Markets: Canada’s TSX reversed most of last week’s gain, falling -0.8%, while across the Atlantic the United Kingdom’s FTSE fell -1.3%. On Europe’s mainland, France’s CAC 40 fell -1.6%, Germany’s DAX retreated ‑1.6%, and Italy’s Milan FTSE gave up ‑2.0%. Major Asian markets were mixed. China’s Shanghai Composite rallied 3.1%, but Japan’s Nikkei ended down -2.6%. As grouped by Morgan Stanley Capital International, developed markets finished the week down -0.7%, while emerging markets surged 2.8%.
Commodities: Precious metals rebounded this week with Gold rising 1.2% to close at $1223 an ounce, and silver gaining 1.7% to close at $14.38 an ounce. Oil, however, remains unable to find a bottom. West Texas Intermediate crude oil had its sixth consecutive week of losses, plunging -5.8% to close at $56.68 per barrel. Copper, seen as a barometer of global economic health due to its variety of uses, made up most of last week’s losses by rallying 4.3%.
U.S. Economic News: The number of Americans who applied for new unemployment benefits ticked up last week, but remained near historically low levels. The Labor Department reported initial claims for unemployment insurance rose by 2,000 to 216,000—slightly above consensus forecasts of 215,000. The monthly average of new claims also rose, up 1,500 to 215,250. Continuing claims, which counts the number of people already receiving unemployment benefits, rose by 46,000 to 1.68 million. Nonetheless, both readings remained near multi-decade lows, which is a sign that labor market conditions continue to be tight.
The National Federation of Business (NFIB) reported its optimism index ticked down 0.5 points last month to 107.4, missing the consensus expectation of 107.9. The index remains just slightly off its record high of 108.4 reached this past summer. The index remains at a level consistent with strong economic growth. In the details, half of the ten NFIB components edged down slightly, while four remained unchanged and one ticked up. Respondents thought the outlook for expansion had weakened somewhat amid a softer earnings trend and slightly lower expected real sales growth. Of note, the share of firms planning to raise their prices in the next few months shot up to 28% – the most since August 2008. That indicates a rising risk of higher inflation.
Americans paid more for gas, rent, and vehicles last month, according to the latest reading of the Consumer Price Index (CPI). The Bureau of Labor Statistics reported that the CPI increased 0.3% in October, the most since January. More than a third of the increase in headline inflation was due to higher gasoline prices. That, plus higher electricity prices, pushed the energy index up 2.4%, also the most since January. The biggest contributors to the increase in core prices were shelter, used cars and trucks, and household furnishings. Year over year, CPI inflation was up 2.5%, up 0.2% from the previous month. Analysts state that the report confirms inflation pressures are rising modestly, ensuring that the Fed will remain on its current course of policy normalization with another interest rate increase expected in December.
Retail sales surged 0.8% in October, the most in five months, blowing away consensus expectations of a 0.5% gain. The increase was broad-based with several categories posting gains of at least 1%. The increase followed small back-to-back declines in September and August. Increased fuel costs were a large part of the gain, as were sales of new cars and trucks. Stripping out gas and autos, sales rose a more modest 0.3%. Despite the headline gain, not all analysts were enthused. Michael Pearce senior U.S. economist at Capital Economics wrote, “Looking beyond the 0.8% surge in headline retail sales, which was boosted by a price-related rise in gasoline sales, there are signs that underlying spending growth has begun to slow.”
The outlook for U.S. manufacturing became less clear as two widely-followed manufacturing reports gave vastly different readings this week. In the New York region, the New York Fed reported factory activity expanded at a robust pace. The New York Fed’s Empire State General Business Conditions Index rose 2.2 points this month to 23.3, beating expectations of a 1.1-point decline. In the report, shipments and employment picked up, while new orders eased slightly. The Expectations Index rose 4.6 points to 33.6 as the outlook for growth in the near future improved. However, in the city of Brotherly Love, the Philadelphia Fed’s factory activity index moderated notably this month. The report from Philadelphia showed its General Activity Index falling 9.3 points to 12.9 – the second lowest level since November of 2016. The consensus expectation was for just a 2.2 point pullback. In addition, almost all individual activity indexes declined, led by a 10.2 point drop in new orders to 9.1, its lowest reading in over two years. The Future Activity Index for Philadelphia fell 6.6 points to 27.2 indicating less optimism about the growth outlook in the next six months.
International Economic News: The Bank of Canada reported its overall perceived risk to the Canadian financial system has increased slightly over the last six months, in part due to unease over the global economic outlook. The central bank’s semiannual survey of risk management professionals showed that 44% felt the chances of a high-impact event with the potential to severely impair the financial system had grown slightly, while 50% continued to report no change. Compared to the prior survey, respondents perceived a higher chance of the global economic outlook deteriorating and were concerned about a reduction in market liquidity. About a quarter of those polled in the survey said a 150- to 200-basis point rise in Canadian five-year interest rates over a 12-month period could trigger adverse events like a housing price correction or a large increase in household defaults. The bank, as well as government policymakers, have expressed repeated concern that Canada’s housing markets – in particular, those in the major cities of Toronto and Vancouver – might be at risk of overheating.
Inflation in the United Kingdom held steady in October as rising fuel prices were offset by lower food and clothing costs. The UKs Office for National Statistics reported consumer prices in October were 2.4% higher than at the same time a year earlier, the same rate of inflation as in September. Economists had expected the rate of inflation to rise slightly to 2.5%. Jason Lennard, senior economist at the National Institute of Economic and Social Research, said there was “evidence that inflationary pressures were subsiding” as shops were permanently cutting prices. The inflation figures follow wage growth data published on Tuesday, which found pay growth accelerated in the three months to the end of September. The Bank of England has justified increases in interest rates on the basis that rising labor costs would be passed along to consumers.
In a rather alarming announcement, French Economy Minister Bruno Le Maire stated that advocates for Britain’s exit from the European Union must choose between accepting the deal negotiated by London and Brussels for leaving the EU or risk “economic disaster” and that a number of politicians in Britain were “lying”. At a Paris forum Le Maire stated, “The choice now faced by British political leaders who have advocated Brexit is to renounce their absurd political promise or face economic disaster, with the British people the main victims.” Le Maire appeared to be going on the attack as British Prime Minister Theresa May battled to salvage her draft Brexit deal after several ministers resigned and members of her own conservative party plotted to oust her.
The German economy has contracted for the first time since 2015. According to Reuters, initial third-quarter growth data showed the German economy shrunk by -0.2% from the previous quarter. The Economy Ministry said Germany had seen weak private consumption and strong imports in the third quarter which had a negative impact on foreign trade’s contribution to growth. Shockingly, German car production was down ‑24% in September from the same month a year before—and new car registrations were down more than ‑31% from the same time last year. German Economics Minister Peter Altmaier downplayed the results stating, “It is a difficult moment (but) all the international institutions, economic experts agree that Germany is still in good economic shape and that economic growth will continue to produce positive effects.”
Data this week showed credit growth in China slowed sharply last month, despite increased injections of liquidity by China’s central bank. The stubbornly weak credit growth has spurred talks of cutting China’s benchmark lending rates, but economists and policy insiders have voiced concerns that an interest rate cut could weaken China’s currency. However, others such as Chen Zheng, senior analyst at China Merchants Bank feel there is a need to act now. Zheng stated succinctly, “There is a need to cut interest rates.” The People’s Bank of China has not cut its benchmark 1-year lending rate since October 2015, opting instead to use other more targeted policy tools, such as extending more loans to struggling sectors. China’s economic growth has cooled to its weakest pace since the global financial crisis and is expected to soften further in coming months if domestic demand is slow to recover and the United States piles more tariffs on Chinese goods.
Japan’s economy contracted more than expected in the third quarter, as natural disasters and a decline in exports took their toll. Preliminary figures showed Japan’s economy contracted an annualized 1.2% in the third quarter. Economists had expected a decline of just 1%. Exports had their fastest decline in more than three years, falling ‑1.8% from the previous quarter. Exports took their toll, but a sharp decline in domestic demand was the another big reason the economy shrank. Strong typhoons and a powerful earthquake halted factories and stifled consumption, although economists say that disruptions were temporary and the decline in exports is more worrying. It’s believed the US-China trade war could hit Japan particularly hard because of its important role in the global supply chain.
Finally: As essentially all things related to home buying seem to be increasing in cost, it’s no surprise that the number of potential home buyers is falling. What is a surprise, however, is the rate of the plunge. The National Association of Home Builders reports that only 13% of Americans now say they plan to buy a home within the next 12 months. That marks the third straight quarter of declines, and is down by almost half of the number seen at the end of 2017.

(sources: all index return data from Yahoo Finance; Reuters, Barron’s, Wall St Journal, Bloomberg.com, ft.com, guggenheimpartners.com, zerohedge.com, ritholtz.com, markit.com, financialpost.com, Eurostat, Statistics Canada, Yahoo! Finance, stocksandnews.com, marketwatch.com, wantchinatimes.com, BBC, 361capital.com, pensionpartners.com, cnbc.com, FactSet) These are the opinions of WE Sherman and Co and not necessarily those of Cambridge, are for informational purposes only, and should not be construed or acted upon as individualized investment advice.
Securities offered through Registered Representatives of Cambridge Investment Research Inc., a broker-dealer, member FINRA/SIPC. Advisory Services offered through Cambridge Investment Research Advisors, a Registered Investment Adviser. Strategic Investment Partners and Cambridge are not affiliated.
Indices mentioned are unmanaged and cannot be invested into directly. Past performance is no guarantee of future results. All Investing involves risk. Depending on the types of investments, there may be varying degrees of risk. Investors should be prepared to bear loss, including total loss of principal.