11-18-19 Weekly Market Update
The Very Big Picture:
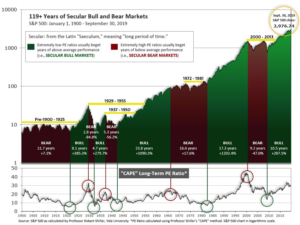
The long-term valuation of the market is commonly measured by the Cyclically Adjusted Price to Earnings ratio, or “CAPE”, which smooths out shorter-term earnings swings in order to get a longer-term assessment of market valuation. A CAPE level of 30 is considered to be the upper end of the normal range, and the level at which further PE-ratio expansion comes to a halt (meaning that increases in market prices only occur in a general response to earnings increases, instead of rising “just because”). The market is currently at that level.
Of course, a “mania” could come along and drive prices higher – much higher, even – and for some years to come. Manias occur when valuation no longer seems to matter, and caution is thrown completely to the wind as buyers rush in to buy first and ask questions later. Two manias in the last century – the 1920’s “Roaring Twenties” and the 1990’s “Tech Bubble” – show that the sky is the limit when common sense is overcome by a blind desire to buy. But, of course, the piper must be paid and the following decade or two are spent in Secular Bear Markets, giving most or all of the mania gains back.

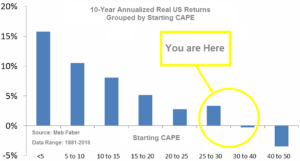
See Fig. 1 for the 100-year view of Secular Bulls and Bears. The CAPE is now at 30.34, down from the prior week’s 30.54, above the level reached at the pre-crash high in October, 2007. Since 1881, the average annual return for all ten year periods that began with a CAPE around this level have been in the 0% – 3%/yr. range. (see Fig. 2).

In the Big Picture:
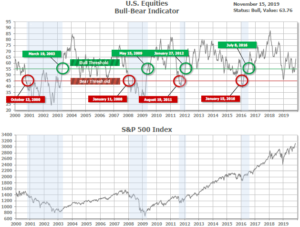
The “big picture” is the months-to-years timeframe – the timeframe in which Cyclical Bulls and Bears operate. The U.S. Bull-Bear Indicator (see Fig. 3) is in Cyclical Bull territory at 63.76, up from the prior week’s 61.33.

In the Intermediate and Shorter-term Picture:
The Shorter-term (weeks to months) Indicator (see Fig. 4) is positive. The indicator ended the week at 28, up from the prior week’s 27. Separately, the Intermediate-term Quarterly Trend Indicator – based on domestic and international stock trend status at the start of each quarter – was positive entering October, indicating positive prospects for equities in the fourth quarter of 2019.

Timeframe Summary:
In the Secular (years to decades) timeframe (Figs. 1 & 2), the long-term valuation of the market is historically too high to sustain rip-roaring multi-year returns. The Bull-Bear Indicator (months to years) remains positive (Fig. 3), indicating a potential uptrend in the longer timeframe. In the intermediate timeframe, the Quarterly Trend Indicator (months to quarters) is positive for Q4, and the shorter (weeks to months) timeframe (Fig. 4) is positive. Therefore, with three indicators positive and none negative, the U.S. equity markets are rated as Positive.
In the Markets:
U.S. Markets: The majority of U.S. indexes ended the week higher as investors continued to look for any indication of progress in U.S.-China trade negotiations. The Dow Jones Industrial Average and large cap S&P 500 index, as well as the technology-heavy NASDAQ Composite all established record highs. The smaller-cap benchmarks lagged and ended the week mixed. The Dow rallied 323 points to close at 28,004, a gain of 1.2%. The NASDAQ added 0.8% ending the week at 8,540. By market cap, the large cap S&P 500 gained 0.9% and the mid cap S&P 400 added 0.1%, but the small cap Russell 2000 declined -0.2%.
International Markets: Canada’s TSX rose for a fourth consecutive week, adding 0.9%, while the United Kingdom’s FTSE retreated -0.8%. On Europe’s mainland, France’s CAC 40 rose 0.8%, Germany’s DAX gained 0.1%, and Italy’s Milan FTSE added 0.2%. In Asia, China’s Shanghai Composite dropped -2.5% and Japan’s Nikkei gave up -0.4%. As grouped by Morgan Stanley Capital International, developed markets finished down -1.3%, while emerging markets ticked down -0.1%.
Commodities: Precious metals retraced some of last week’s plunge. Gold rose $5.60 to $1468.50 an ounce, a gain of 0.4%, and silver recovered 0.7% to finish the week at $16.95 an ounce. Oil rose for a second consecutive week. West Texas Intermediate crude oil gained 0.8% to $57.72 per barrel. The industrial metal copper, viewed by some analysts as a barometer or world economic health due to its variety of uses, retreated -1.6%.
U.S. Economic News: The number of Americans seeking first-time unemployment benefits jumped to a nearly 5‑month high last week, the Labor Department reported. Initial jobless claims rose 14,000 to a seasonally-adjusted 225,000 last week, the government said. Economists had estimated new claims would total only 215,000. The less-volatile monthly average of new claims rose a much smaller 1,750 to 217,000. The four-week average gives a more stable view of the labor market than the weekly number. Most analysts view the increase as an anomaly in the Labor Department’s seasonal adjustment calculations. Scott Brown chief economist at Raymond James wrote in a research note, “Jobless claims rose more than anticipated, but that’s just seasonal noise (the trend remains low).” Continuing claims, which counts the number of Americans already receiving unemployment benefits, fell by 10,000 to 1.68 million. That number remains near its lowest level since 1970.
The Commerce Department reported that sales at U.S. retailers rebounded last month, but the pace of spending appears to have slowed since the beginning of the year. Retail sales increased 0.3% last month, matching economists’ forecasts. Car dealers, gas stations, and internet stores reaped most of the gains. Most other retailers posted soft results just before the start of the holiday shopping season. Excluding the auto and gasoline categories, sales were up just 0.1%. Furthermore, the pace of sales over the past 12 months has slowed to 3.1% in October, down from 4.1%–a five month low. Still, given the strongest labor market in decades, Americans appear to be in a good position to spend during the upcoming holiday season. Given that household spending accounts for 70% of U.S. economic activity, consumer spending is essential to keep the U.S. economy out of recession.
U.S. consumers paid higher prices for gasoline, vehicles, medical care, and recreation last month according to the Bureau of Labor Statistics, but overall inflation remained low and fairly stable. The Consumer Price Index jumped 0.4% in October, with fuel costs accounting for more than half of the increase. Economists had expected only a 0.3% advance. Over the past year, the cost of living has increased 1.8%–still well below last year’s peak of 3% and just shy of the Federal Reserve’s target of 2%. The measure that strips out the volatile food and energy categories, so-called “core inflation”, ticked down from 2.4% to 2.3%. The relatively low rate of inflation has given the Federal Reserve leeway to cut interest rates to extend the economic expansion entering its 11th year.
At the wholesale level, the cost of goods and services posted their sharpest increase in half a year last month. However, almost all of the gain was due to higher gasoline prices. The Bureau of Labor Statistics reported its producer price index rose 0.4% last month, 0.1% higher than the estimate of economists. More broadly, however, producer prices continued to recede. The 12-month rate of wholesale inflation fell to a three-year low of 1.1% from 1.4%. The yearly rate was as high as 3.4% just eighteen months ago. Core PPI, that strips out food and energy was up just 0.1% last month. The 12-month core rate slowed to 1.5% from 1.7%–also a three-year low. Andrew Hunter, senior economist at Capital Economics wrote, “Overall, this all supports our view that there is little danger of inflation rising sustainably above the Fed’s [2%] target. In that environment, interest rates are likely to remain on hold for the foreseeable future.”
Absent a material deterioration in the economy, Federal Reserve Chairman Jerome Powell stated interest rate changes will be on hold for the foreseeable future. In remarks to the Joint Economic Committee of Congress Powell stated, “We see the current stance of monetary policy as likely to remain appropriate as long as incoming information about the economy remains broadly consistent with our outlook of moderate economic growth, a strong labor market, and inflation near our symmetric 2% objective.” The Fed has cut interest rates in three quarter-point moves since July, putting the Fed’s benchmark federal funds rate in a range of 1.5%-2%. In further testimony, Powell noted that weakness in the manufacturing sector has not spilled over into the broader economy. The Fed chairman said the economy is being driven by the consumer. “The 70% of the economy that is the consumer’s is healthy, with high confidence, low unemployment, wages moving up,” he said.
In the New York region, manufacturing activity remained sluggish for a sixth consecutive month according to the New York Federal Reserve. The New York Fed’s Empire State business conditions index fell 1.8 points to 1.1 in November. Economists had expected a reading of 5.0. In the details of the report, the new orders index ticked up 2 points to 5.5, while the shipments index fell 4 points to 8.8. Inventories declined and optimism about conditions six months from now remained subdued. Manufacturing in the U.S. has been hit by the trade dispute with China, a relatively strong U.S. dollar making U.S. goods more expensive overseas, and an overall slowdown in global economic growth.
International Economic News: Stocks are reaching record highs in Canada, but some analysts say Canada’s economic outlook isn’t exactly flashing green. The Bank of Canada has begun considering lowering borrowing costs as growth slows and corporate profits come in below expectations, yet the country’s stock market has reached a new peak. David Rosenberg, chief economist at Gluskin Sheff noted the dichotomy between current macro conditions and market sentiment in a note to clients. “When it comes to data, ‘less bad’ is also being treated as ‘good’”, he wrote. “Oh, yes, earnings are declining but at least they’re beating expectations!” Canada’s economy is nowhere near peak growth. Economists expect the economy to decelerate to a yearly pace of 1.5% for this year and next—in line with expectations for slower global growth.
The UK economy grew at its slowest annual rate in a decade, but managed to avoid going into a recession in the third quarter. The Office for National Statistics reported the economy expanded by 1% in the three months ended September compared to the same time last year. It was the weakest annual growth rate since the beginning of 2010. Following a negative reading in the second quarter, the positive result meant the country hadn’t met the criteria for recession of two consecutive negative quarters. Analysts attribute the weakness to the uncertainty over Britain’s exit from the European Union. “Unless Brexit uncertainty fades and a fiscal boost is forthcoming, then this might make the Bank of England more inclined to cut interest rates before long,” said Ruth Gregory, senior UK economist at Capital Economics.
On Europe’s mainland, the Bank of France estimated GDP growth will slip to just 0.2% in the fourth quarter. The reading would mark a slowdown from the third quarter as international trade disputes weigh on the outlook for the global economy. The French central bank reported its survey of business leaders showed industrial production and construction activity has slowed in November. The bank’s measure of sentiment in services declined a point to 98 in October. France’s economy has thus far managed to defy forecasts of a slowdown in the third quarter after the government injected billions of euros of stimulus following widespread “yellow vest” protests.
Germany narrowly avoided a technical recession after economic growth returned in the third quarter – barely. Officially defined as two consecutive quarters of negative readings, the latest figures showed the country’s economy grew by 0.1% in the third quarter. On an annual basis, the economy grew by 0.5% from July to September the Federal Statistics Office reported. Claus Vistesen, chief euro zone economist at Pantheon Macroeconomics wrote, “No recession, but most definitely a very weak economy.” Furthermore, the data puts policymakers in a bit of a “no-man’s land” with respect to policy. “In some sense, this is the ‘worst of both worlds’ for markets. Today’s data confirm that the German economy has now stalled, but the headlines are probably not dire enough to prompt an immediate and aggressive fiscal response from Berlin.”
In Asia, China’s industrial output grew at a significantly slower rate than expected last month, as weakness in global and domestic demand weighed on the world’s second-largest economy. China’s National Bureau of Statistics reported industrial production rose 4.7% year-over-year in October, missing forecasts of 5.4% growth. Other indicators showed weakness as well. Growth in retail sales fell back to a near 16-year low, and fixed asset investment growth was the weakest on record. Analysts state the disappointing economic data will most likely force Beijing to roll out fresh support for the economy. Furthermore, Chinese consumers have been hit with higher food prices over the past few months as the price of pork and other meats have soared.
Growth in the world’s third-largest economy fell sharply as Japanese exports slowed amid a weakening global economy and regional trade conflicts. Japan’s economy grew at an annualized rate of 0.2% in the third quarter according to data from Japan’s Cabinet Office. The results were below economists’ expectations of a slowing growth but not as dramatic a drop. The performance was a sharp pullback from the previous quarter where the economy had risen at a rate of 1.8%. The latest reading suggests that Japan’s economy may not be as resilient as many analysts had expected. In addition, private consumption also slowed from the previous quarter, casting doubt on the Bank of Japan’s view that robust domestic demand will offset the impact from intensifying global risks.
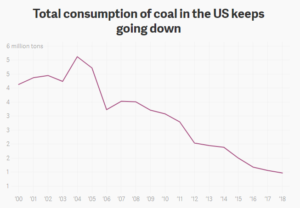
Finally: Despite President Donald Trump’s campaign assurances that he would put West Virginia coal miners “back to work”, the president of the United Mine Workers of America recently rather bluntly that “Coal’s not back. Nobody saved the coal industry.” He said despite promises from both sides of the political spectrum, coal fired plants are closing all over the country, calling it a “harsh reality”. Only one, relatively small, new coal-fired generator with a capacity of 17 megawatts is expected to come online by the end of the year and overall coal consumption is expected to decline a further 8% from last year’s levels even while the US economy continues to expand. The main reason? A period of sustained, low natural gas prices and lots of supply (mostly due to fracking) has kept the cost of generating electricity with natural gas competitive with generation from coal. In addition, increased competition from renewable energy sources have also contributed to the decline. This chart, from theatlas.com, shows the steep downward slope.

(Sources: all index return data from Yahoo Finance; Reuters, Barron’s, Wall St Journal, Bloomberg.com, ft.com, guggenheimpartners.com, zerohedge.com, ritholtz.com, markit.com, financialpost.com, Eurostat, Statistics Canada, Yahoo! Finance, stocksandnews.com, marketwatch.com, wantchinatimes.com, BBC, 361capital.com, pensionpartners.com, cnbc.com, FactSet) Securities offered through Registered Representatives of Cambridge Investment Research Inc., a broker-dealer, member FINRA/SIPC. Advisory Services offered through Cambridge Investment Research Advisors, a Registered Investment Adviser. Strategic Investment Partners and Cambridge are not affiliated.
Indices mentioned are unmanaged and cannot be invested into directly. Past performance is no guarantee of future results. All Investing involves risk. Depending on the types of investments, there may be varying degrees of risk. Investors should be prepared to bear loss, including total loss of principal.
