
11-12-18 Weekly Market Update
The very big picture:
In the “decades” timeframe, the current Secular Bull Market could turn out to be among the shorter Secular Bull markets on record. This is because of the long-term valuation of the market which, after nine years, has reached the upper end of its normal range.
The long-term valuation of the market is commonly measured by the Cyclically Adjusted Price to Earnings ratio, or “CAPE”, which smooths out shorter-term earnings swings in order to get a longer-term assessment of market valuation. A CAPE level of 30 is considered to be the upper end of the normal range, and the level at which further PE-ratio expansion comes to a halt (meaning that increases in market prices only occur in a general response to earnings increases, instead of rising “just because”).
Of course, a “mania” could come along and drive prices higher – much higher, even – and for some years to come. Manias occur when valuation no longer seems to matter, and caution is thrown completely to the wind as buyers rush in to buy first and ask questions later. Two manias in the last century – the 1920’s “Roaring Twenties” and the 1990’s “Tech Bubble” – show that the sky is the limit when common sense is overcome by a blind desire to buy. But, of course, the piper must be paid and the following decade or two are spent in Secular Bear Markets, giving most or all of the mania gains back.
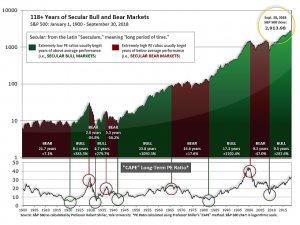
See Fig. 1 for the 100-year view of Secular Bulls and Bears. The CAPE is now at 31.27, up from the prior week’s 30.71, and exceeds the level reached at the pre-crash high in October, 2007. This value is in the lower end of the “mania” range. Since 1881, the average annual return for all ten year periods that began with a CAPE around this level have been in the 0% – 3%/yr. range. (see Fig. 2).

In the big picture:
The “big picture” is the months-to-years timeframe – the timeframe in which Cyclical Bulls and Bears operate. The U.S. Bull-Bear Indicator (see Fig. 3) is in Cyclical Bull territory at 58.35, up from the prior week’s 57.79.

In the intermediate and Shorter-term picture:
The Shorter-term (weeks to months) Indicator (see Fig. 4) turned positive on October 16th. The indicator ended the week at 19, up sharply from the prior week’s 10. Separately, the Intermediate-term Quarterly Trend Indicator – based on domestic and international stock trend status at the start of each quarter – was positive entering October, indicating positive prospects for equities in the fourth quarter of 2018.

Timeframe summary:
In the Secular (years to decades) timeframe (Figs. 1 & 2), the long-term valuation of the market is simply too high to sustain rip-roaring multi-year returns – but the market has entered the low end of the “mania” range, and all bets are off in a mania. The only thing certain in a mania is that it will end badly…someday. The Bull-Bear Indicator (months to years) is positive (Fig. 3), indicating a potential uptrend in the longer timeframe. In the intermediate timeframe, the Quarterly Trend Indicator (months to quarters) is positive for Q4, and the shorter (weeks to months) timeframe (Fig. 4) is positive. Therefore, with three indicators positive and none negative, the U.S. equity markets are rated as Positive.
In the markets:
U.S. Markets: U.S. stocks ended the week higher but gave back a portion of their gains on Friday. Large cap indexes outperformed both the technology-heavy NASDAQ Composite index and smaller-cap benchmarks. The Dow Jones Industrial Average surged 718 points or 2.8% to end the week at 25,989. The NASDAQ Composite rose 0.7% closing at 7,406. By market cap, the large cap S&P 500 rose 2.1%, while the S&P 400 midcap index added 1.1%, and the struggling small cap Russell 2000 managed just a 0.1% gain. The Russell 2000 is on the verge of what traders call a “death cross”, which occurs when the shorter-term 50-day moving average crosses beneath the longer-term 200-day moving average.
International Markets: Canada’s TSX followed last week’s gain with another one of 1.0%, while across the Atlantic the United Kingdom’s FTSE rose 0.2%. On Europe’s mainland, both Germany’s DAX and France’s CAC 40 added 0.1%. Italy’s Milan FTSE retreated -0.7%. In Asia, China’s Shanghai Composite retraced almost all of last week’s gain falling -2.9%. Japan’s Nikkei ended up just 0.03%. As grouped by Morgan Stanley Capital International, developed markets rose 0.1%, while emerging markets stumbled -2.5%.
Commodities: Precious metals lost their luster as financial markets finished the week higher. Gold fell 2%, or ‑$24.70, to close at $1208.60 an ounce. Silver plunged over 4%, closing at $14.14 an ounce. Oil had its fifth consecutive negative weekly close giving up -4.7%, and Friday marked the 10th consecutive days of falling prices – a dubious accomplishment not seen since 1984. West Texas Intermediate crude oil finished the week at $60.19 per barrel. Copper, seen by some analysts as an indicator of global economic health due to its variety of uses, had its fourth down week out of the last five, finishing the week down -1.9%.
U.S. Economic News: The number of Americans collecting new unemployment benefits fell to the lowest level since 1973 last week, reinforcing the downward trend in layoffs that is expected to continue. The Labor Department reported initial jobless claims fell by 1,000 to 214,000 last week. In addition, the more stable monthly average of claims also declined by 250 to 213,750. Continuing claims, which counts the number of Americans already receiving unemployment benefits, fell by 8,000 to 1.62 million—also marking its lowest level since 1973. Initial claims have been below 220,000 for four and a half months, a remarkably long stretch of extremely low layoffs.
The number of job openings in the United States retraced in September, a month after setting an all-time high. The Labor Department’s Job Openings and Labor Turnover Survey (JOLTS) reported job openings slipped to 7 million on the last day of September, down from a record 7.3 million in August. However, companies are still scrambling to find workers and offering higher pay and benefits to attract them. Even after the decline, the number of job openings still exceeds the number of Americans officially classified as unemployed by a huge 900,000. The number of job openings first surpassed the number of unemployed in the early spring. The “quits rate”, widely believed to be the Federal Reserve’s favored measure of the jobs market as it is assumed that a worker would only leave a current job for an even better one, remained unchanged at 2.7% among private-sector employees. That number is at its highest level of the current expansion and close to the record high of 2.9% set in 2001.
The U.S. economy is still running strong according to the latest survey from the Institute for Supply Management (ISM). ISM’s services survey showed its index fell just slightly last month, remaining near its 21-year high. ISM’s non-manufacturing index slipped 1.3 point to 60.3 in October with numbers over 50 generally viewed as positive for the economy, and readings over 55 considered exceptional. In the details, almost every major service industry expanded in October. Education was the only component to show a decline. The biggest complaints among survey respondents continue to be uncertainty caused by U.S. tariffs, difficulty securing transportation, and other constraints on production. The index is compiled from a survey of executives who oversee ordering raw materials and other supplies for their companies.
Americans remain upbeat about the economy despite the recent stock market volatility and rising interest rates, a survey of consumers showed. The University of Michigan reported its consumer sentiment index fell just 0.3 point to 98.3 in November, in line with economists’ forecasts. The index has averaged 98.4 over the past year—the highest level since 2000. In the details, younger people are optimistic that wages and incomes will continue to rise, while older Americans worry about erosion in their standard of living due to higher interest rates. Notably, the 2018 elections didn’t appear to have a significant impact on consumers’ attitudes.
The Federal Reserve held its key interest rates steady this week, signaling that they will stay the course and move rates up at a gradual pace in the coming months. In a move that was widely expected, the Fed kept its benchmark target for rates unchanged at 2-2.25% and left its policy statement unchanged. The statement said, “With jobs gains “strong” and economic activity “rising at a strong rate”, the “Committee expects further gradual increases in the target range for the federal funds rate.” Furthermore, the Fed noted that inflation remained near its 2% target. The only change was that the Fed noted that business investment had moderated in the third quarter. Analysts currently see a roughly 80% chance of a quarter-point rate hike at the Fed’s next meeting in December.
International Economic News: Bank of Canada governor Stephen Poloz stated in a speech in London this week that the global economy was strong enough for stimulus to be “steadily withdrawn”. The remarks came as the Bank of Canada signaled it would gradually raise its benchmark interest rate from its current level of 1.75% to “somewhere between 2.5% and 3.5%”. Poloz recently hiked interest rates for the fifth time in 15 months and warned Canadians to get used to 3% interest rates as the “new normal”. Surprisingly, governor Poloz stated that the recent market volatility in October was actually a good thing. Mr. Poloz said the longstanding trend toward lower bond yields appears to be over as interest rates rise and risks are shifted back to markets. The change is producing a recalibration in equity markets and leading to a more normal level of volatility, he said. “These characteristics do not point to a gloomy economic outlook by any means,” Mr. Poloz said. “Rather, they are welcome symptoms of normalization.”
The United Kingdom’s Office for National Statistics (ONS) reported the UK economy expanded at its fastest pace since late 2016. The ONS reported the UK economy grew by 0.6% in the third quarter, in line with predictions from the Bank of England and other forecasts. It was the highest quarterly growth figure since the fourth quarter of 2016, when the economy grew 0.7%. However, in the details of the report, robust growth in July was offset by a slowdown in August and September. Analysts warned the economy had “little underlying momentum” and growth would decline in the fourth quarter.
French unions began another contentious round of negotiations this week as President Emmanuel Macron’s government looked to step up reforms of the country’s unemployment system. The French President intends to bring unemployment down by reducing the number of short-term contracts and making long-term work more attractive to job seekers. Mr. Macron also wants to make it less attractive for people to go in and out of employment while claiming benefits. Philippe Martin, who heads the French Council of Economic Advisers said, “The general issue in France is that even if we created quite a lot of jobs, [full-time] unemployment is still not decreasing.”
Germany’s Council of Economic Experts stated it expects 1.6% growth for Germany this year, but only 1.5% next year—a drastic reduction from the 2.2% they had forecast a year ago. Geopolitical issues remained as the top concern of the council. In their report, they noted that the German economy is in one of its longest upswings since World War II but wrote that “a less favorable foreign trade environment, temporary production issues and capacity bottlenecks are slowing the pace of expansion.” Jorg Kramer, chief economist at Commerzbank agreed with the findings in a note stating, “The downgrade is reasonable. There are big downside risks to the German economy, and all the latest business surveys and confidence indicators have been worse than expected.”
China’s central bank, The People’s Bank of China, stated the Chinese economy was facing downward pressure in the its most recent update of its monetary policy implementation report. China’s gross domestic product slowed to 6.5% in the third quarter, its weakest quarterly reading since the global financial crisis. The report came as Li Yang, head of the National Institution for Finance and Development, forecasted that China’s economic expansion may be entering a long-term “downward spiral” as all three engines of growth—investment, exports, and consumption—slow. Li said in a speech, “We need to pay extremely close attention because it might mean that the economy is in a kind of downward spiral. “
A Reuter’s survey of economists showed Japan’s economy is expected to contract in the third quarter following natural disasters that disrupted production and a slowdown in overseas demand that undermined exports. Analysts expect Japan’s economy will recover from the setbacks caused by the strong typhoons that hit western Japan and the earthquake that hit Hokkaido, but still see risks to growth from declining momentum in the global economy. Yoshiki Shinke, chief economist at Dai-ichi Life Research Institute commented that economic data for the third quarter “will likely show the economy was at a standstill.” Yoshimasa Maruyama, chief market economist at SMBC Nikko Securities noted, “the global economy has already hit its peak and there is a growing risk that downward pressure from the Sino-U.S. trade war could intensify in 2019.”
Finally: It is well-known that the United States economy is the largest in the world, but by how much? Mark Perry at the American Enterprise Institute created a very interesting infographic that shows each of the individual states in the U.S., labeled with the name of a country of comparable GDP. For example, the GDP of Colorado is equivalent to the GDP of Ireland, Texas is equivalent to Canada, etc.

(sources: all index return data from Yahoo Finance; Reuters, Barron’s, Wall St Journal, Bloomberg.com, ft.com, guggenheimpartners.com, zerohedge.com, ritholtz.com, markit.com, financialpost.com, Eurostat, Statistics Canada, Yahoo! Finance, stocksandnews.com, marketwatch.com, wantchinatimes.com, BBC, 361capital.com, pensionpartners.com, cnbc.com, FactSet) ) These are the opinions of WE Sherman and Co and not necessarily those of Cambridge, are for informational purposes only, and should not be construed or acted upon as individualized investment advice.
Securities offered through Registered Representatives of Cambridge Investment Research Inc., a broker-dealer, member FINRA/SIPC. Advisory Services offered through Cambridge Investment Research Advisors, a Registered Investment Adviser. Strategic Investment Partners and Cambridge are not affiliated.
Indices mentioned are unmanaged and cannot be invested into directly. Past performance is no guarantee of future results. All Investing involves risk. Depending on the types of investments, there may be varying degrees of risk. Investors should be prepared to bear loss, including total loss of principal.