
11-11-2019 Weekly Market Update
The Very Big Picture:
The long-term valuation of the market is commonly measured by the Cyclically Adjusted Price to Earnings ratio, or “CAPE”, which smooths out shorter-term earnings swings in order to get a longer-term assessment of market valuation. A CAPE level of 30 is considered to be the upper end of the normal range, and the level at which further PE-ratio expansion comes to a halt (meaning that increases in market prices only occur in a general response to earnings increases, instead of rising “just because”). The market is currently at that level.
Of course, a “mania” could come along and drive prices higher – much higher, even – and for some years to come. Manias occur when valuation no longer seems to matter, and caution is thrown completely to the wind as buyers rush in to buy first and ask questions later. Two manias in the last century – the 1920’s “Roaring Twenties” and the 1990’s “Tech Bubble” – show that the sky is the limit when common sense is overcome by a blind desire to buy. But, of course, the piper must be paid and the following decade or two are spent in Secular Bear Markets, giving most or all of the mania gains back.
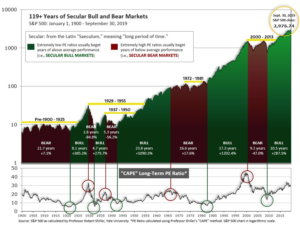
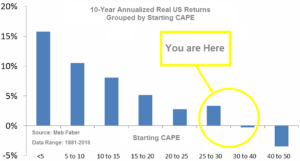
See Fig. 1 for the 100-year view of Secular Bulls and Bears. The CAPE is now at 30.54, up from the prior week’s 30.28, above the level reached at the pre-crash high in October, 2007. Since 1881, the average annual return for all ten year periods that began with a CAPE around this level have been in the 0% – 3%/yr. range. (see Fig. 2).
In the Big Picture:
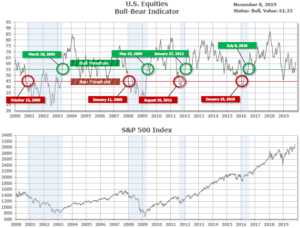
The “big picture” is the months-to-years timeframe – the timeframe in which Cyclical Bulls and Bears operate. The U.S. Bull-Bear Indicator (see Fig. 3) is in Cyclical Bull territory at 61.33, up from the prior week’s 58.84.
In the Intermediate and Shorter-term Picture:
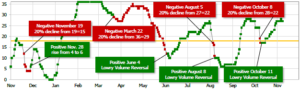
The Shorter-term (weeks to months) Indicator (see Fig. 4) is positive. The indicator ended the week at 27, unchanged from the prior week. Separately, the Intermediate-term Quarterly Trend Indicator – based on domestic and international stock trend status at the start of each quarter – was positive entering October, indicating positive prospects for equities in the fourth quarter of 2019.
Timeframe Summary:
In the Secular (years to decades) timeframe (Figs. 1 & 2), the long-term valuation of the market is historically too high to sustain rip-roaring multi-year returns. The Bull-Bear Indicator (months to years) remains positive (Fig. 3), indicating a potential uptrend in the longer timeframe. In the intermediate timeframe, the Quarterly Trend Indicator (months to quarters) is positive for Q4, and the shorter (weeks to months) timeframe (Fig. 4) is positive. Therefore, with three indicators positive and none negative, the U.S. equity markets are rated as Positive.
In the Markets:
U.S. Markets: The Dow Jones Industrial Average joined the S&P 500 and NASDAQ Composite indexes in all-time high record territory, as optimism grew about a “phase one” trade deal between the U.S. and China. The Dow added 333 points to close at 27,681, a gain of 1.2%. The technology-heavy NASDAQ Composite added 1.1%, ending at 8,475. By market cap, the large cap S&P 500 rose 0.9%, while the S&P 400 mid cap index and Russell 2000 small cap indexes rose 0.8% and 0.6%, respectively.
International Markets: Major international markets were green across the board last week with Canada’s TSX adding 1.7% and the United Kingdom’s FTSE 100 gaining 0.8%. On Europe’s mainland, France’s CAC 40 rallied 2.2%, while Germany’s DAX added 2.1%. In Asia, China’s Shanghai Composite added 0.2% and Japan’s Nikkei gained 2.4%. As grouped by Morgan Stanley Capital International, developed markets rose 0.5% and emerging markets gained 1.1%.
Commodities: Precious metals sold off given the considerable strength in the equities markets. Gold declined ‑3.2% to $1462.90 an ounce, while Silver plunged more than twice gold’s decline, dropping -6.8% to $16.82 an ounce. Oil rebounded nicely from last week’s slight decline, adding 1.9%. West Texas Intermediate crude oil finished the week at $57.24 per barrel. The industrial metal copper, viewed as a gauge of world economic health due to its wide variety of uses, finished the week up 1.1%.
U.S. Economic News: U.S. jobless claims fell to a one-month low last week as the labor market remained strong, and the number of Americans seeking first-time unemployment benefits fell by 8,000 to 211,000. Economists had forecast new claims would total a seasonally-adjusted 215,000. Jobless claims fell the most in California, Georgia and Virginia. Claims had previously risen in California as wildfires and power outages kept many people from work. The monthly average of new claims, smoothed to iron out the weekly volatility, ticked up by 250 to 215,250. Continuing claims, which counts the number of people already collecting unemployment benefits, fell by 3,000 to 1.69 million. Those claims are near their lowest level since the early 1970’s.
The Labor Department’s Job Openings and Labor Turnover Survey (JOLTS) showed the number of job openings fell in September for a fourth consecutive month to 7.02 million. The reading is down from 7.3 million, the Bureau of Labor Statistics reported. Companies have cut back on hiring as the U.S. economy continues to grow more slowly. The “quits rate” component of JOLTS for the private sector ticked down from 2.7% to 2.6%. The quits rate is rumored to be one of the Federal Reserve’s key indicators of the health of the labor market as it’s presumed an employee would only leave a position for a more lucrative one. For all workers, including government employees, the reading fell to 2.3% from 2.4%.
The services side of the U.S. economy rebounded last month after hitting a three-year low, the Institute for Supply Management (ISM) reported. ISM stated its non-manufacturing index rose 2.1 points to 54.7 in October. Economists had expected the index to rise to lesser 53.8. Numbers over 50 indicate businesses are growing. Analysts believe the improvement was predominantly due to the recent thawing in trade tensions between the U.S. and China. Service-oriented companies haven’t been hurt as much by the trade dispute as manufacturing companies, but the spillover effects have resulted in slower growth. The services index is down 6 points from its post-recession peak set last year.
For the first time in almost five years, the productivity of American workers declined. The Labor Department reported that productivity declined at a 0.3% annual rate in the third quarter, reflecting a cutback in production as the economy slowed at the end of summer. Economists had predicted a 0.6% increase in productivity. The decline in productivity might be just temporary if the economy speeds up again, but it could also be a warning sign. Businesses reduced production in response to softer demand, especially for exports. The trade conflict between the U.S. and China has disrupted global supply chains and contributed to a world-wide slowdown in economic growth.
For a second consecutive month, consumers pulled back on their use of credit cards. U.S. consumer borrowing grew at its slowest rate in 15 months in September, according to Federal Reserve data. Total consumer credit increased $9.5 billion, down from a $17.8 billion increase in August. Economists had been expecting a gain of $15 billion. The September gain was well below the monthly average growth for the first eight months of the year of around $16 billion. It translates into an annual growth rate of 2.8%–the slowest since June 2018. T.J. Connelly, head of research at Contingent Macro Research stated, “The credit card spending trend appears to show that while consumers remain willing and able to spend, they are doing so only cautiously and are still reluctant to take on substantial debt.”
Sentiment among the nation’s consumers improved slightly this month, according to the University of Michigan. UofM’s consumer sentiment survey rose slightly to 95.7 this month, up 0.2 point from October. Economists had expected a reading of 95. In the details, consumers’ views on current conditions fell 2.3 points to 110.9, while their expectations of future conditions rose 1.7 points to 85.9. Economists follow readings on sentiment to get an insight into their spending, the backbone of the U.S. economy. Richard Curtin, chief economist of the survey stated, “Although consumers have become somewhat more cautious spenders, they see no reason to engage in the type of retrenchment that causes recessions.”
International Economic News: The Canadian job market expansion came to an unexpected abrupt halt losing a net 1800 positions, Statistics Canada reported. Economists had expected that over 15,000 jobs would be created. The unemployment rate remained at 5.5%. Employment declined most heavily in the manufacturing and construction sectors. Doug Porter, chief economist at BMO Capital Markets stated in a note to clients, “It definitely runs against the grain of very strong job gains we’ve seen through most of the past year.” Porter went on to say “We have to be cautious about reading too much into any one report, but it shows that the economy is not simply on a one-way trip north here.” Canada’s central bank, which has not moved even as its counterparts in Europe and the United States have eased rates, held firm as expected but left the door open to a possible future rate cut.
Representatives of the United Kingdom and the European Union agreed to further postpone the United Kingdom’s exit from the European Union, this time until January 31, 2020. Ironically, political watchers noted that UK Prime Minister Boris Johnson actually made an incredibly compelling argument against his own Brexit deal. Speaking at a meeting in Northern Ireland, the Prime Minister said, “Actually, Northern Ireland has got a great deal. You keep free movement, you keep access to the single market, but you also, as it says in the deal, have unfettered access” to Great Britain. This poses the obvious question that if retaining free movement and staying in the European single market is such a “great deal” for Northern Ireland, then why should the UK prevent that same access and freedom to the rest of its nations.
On Europe’s mainland, after years of lagging Europe’s economic powerhouse Germany, France is now the region’s economic growth engine. French GDP beat economists’ consensus forecast in the third quarter, up 0.3% from the same time last year, while Germany is believed to have remained stagnant over the same period. For the first time in years, France appears to be growing much faster than its bigger neighbor. According to European Union forecast, the French economy is expected to grow by 1.3% this year, compared to 1.1% for the Eurozone as a whole, and just 0.4% for Germany. Analysts state that President Macron’s tax reforms early in his presidency, his business-friendly proclamations, and increased government spending following last year’s “yellow vest” protests have all contributed to the improvement.
With its vast manufacturing industry in recession, Germany’s third-quarter economic data (due to be released this coming week) is widely expected to confirm that Germany as a whole is in a recession. Economists are expecting readings of -0.1%. However, the reading doesn’t change the bigger picture that Germany’s economic pain is expected to last well into the next decade, according to Commerzbank economist Jorg Kramer. Kramer states, “Germany is likely to remain in a zone between modest positive growth and slight GDP declines. Once the downturn is over, however, there is unlikely to be a strong economic recovery … the German export industry will suffer for a long time to come.”
China’s consumer prices rose to a nearly eight year high as the price of pork doubled. China’s consumer prices rose 3.8% last month, the highest since January 2012, according to government data. The increase beat forecasts by 0.4%. The gain was driven primarily by skyrocketing pork prices, which have risen 101.3% from the same time last year. African swine fever has ravaged the country’s pig population and is predicted to wipe out half of China’s pig population by the end of the year. Adding to the problem, the price of poultry soared 66.8% as increased demand for other meats pushed up those prices as well. Absent meat, other price pressures remain tame. Consumer prices for items other than food actually ticked down across various categories by -0.1% to -0.9%.
Japanese Prime Minister Shinzo Abe gave orders for Japan’s first economic stimulus package since 2016 as concerns of a global economic slowdown grow. Government officials vowed to produce an “agile” and “comprehensive” stimulus that will take advantage of ultra-low interest rates and borrow in order to finance public investment. “To speed up our recovery [from natural disasters], deal with risks from abroad and accelerate productivity growth, we are formulating an economic plan along the lines of a 15-month budget,” said Yoshihide Suga, Japan’s chief cabinet secretary. The plan would help boost the economy all the way into 2021 analysts say.
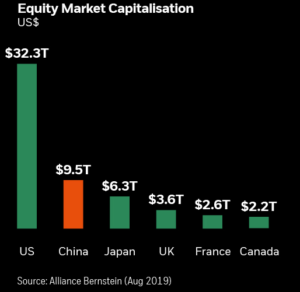
Finally: Since its initial Open Door Policy in 1978, China’ economy has experienced rapid growth to become the world’s second largest economy in GDP terms. In the coming year, China is expected to move into the next phase of opening up its economy by lifting its many restrictions on the foreign ownership of stocks, bonds and other securities. This will make its economy more accessible than ever before, and make investing in China much easier than it is now. As this chart from Alliance Bernstein shows, the Chinese equity market is huge and rapidly expanding, and future diversified global investors will find that including Chinese investments in their portfolios is not an option, but a necessity.
(Sources: all index return data from Yahoo Finance; Reuters, Barron’s, Wall St Journal, Bloomberg.com, ft.com, guggenheimpartners.com, zerohedge.com, ritholtz.com, markit.com, financialpost.com, Eurostat, Statistics Canada, Yahoo! Finance, stocksandnews.com, marketwatch.com, wantchinatimes.com, BBC, 361capital.com, pensionpartners.com, cnbc.com, FactSet) Securities offered through Registered Representatives of Cambridge Investment Research Inc., a broker-dealer, member FINRA/SIPC. Advisory Services offered through Cambridge Investment Research Advisors, a Registered Investment Adviser. Strategic Investment Partners and Cambridge are not affiliated.
Indices mentioned are unmanaged and cannot be invested into directly. Past performance is no guarantee of future results. All Investing involves risk. Depending on the types of investments, there may be varying degrees of risk. Investors should be prepared to bear loss, including total loss of principal.