
11-4-19 Weekly Market Update
The Very Big Picture:
The long-term valuation of the market is commonly measured by the Cyclically Adjusted Price to Earnings ratio, or “CAPE”, which smooths out shorter-term earnings swings in order to get a longer-term assessment of market valuation. A CAPE level of 30 is considered to be the upper end of the normal range, and the level at which further PE-ratio expansion comes to a halt (meaning that increases in market prices only occur in a general response to earnings increases, instead of rising “just because”). The market is currently at that level.
Of course, a “mania” could come along and drive prices higher – much higher, even – and for some years to come. Manias occur when valuation no longer seems to matter, and caution is thrown completely to the wind as buyers rush in to buy first and ask questions later. Two manias in the last century – the 1920’s “Roaring Twenties” and the 1990’s “Tech Bubble” – show that the sky is the limit when common sense is overcome by a blind desire to buy. But, of course, the piper must be paid and the following decade or two are spent in Secular Bear Markets, giving most or all of the mania gains back.
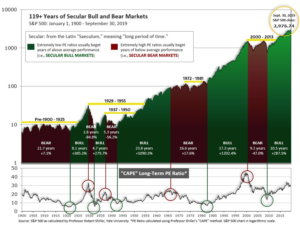
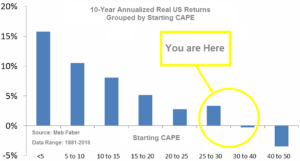
See Fig. 1 for the 100-year view of Secular Bulls and Bears. The CAPE is now at 30.28, up from the prior week’s 29.84, above the level reached at the pre-crash high in October, 2007. Since 1881, the average annual return for all ten year periods that began with a CAPE around this level have been in the 0% – 3%/yr. range. (see Fig. 2).
In the Big Picture:
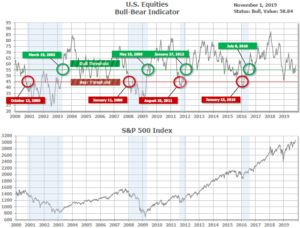
The “big picture” is the months-to-years timeframe – the timeframe in which Cyclical Bulls and Bears operate. The U.S. Bull-Bear Indicator (see Fig. 3) is in Cyclical Bull territory at 58.84, up from the prior week’s 56.33.
In the Intermediate and Shorter-term Picture:
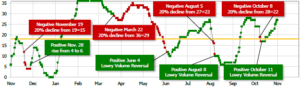
The Shorter-term (weeks to months) Indicator (see Fig. 4) is positive. The indicator ended the week at 27, up from the prior week’s 22. Separately, the Intermediate-term Quarterly Trend Indicator – based on domestic and international stock trend status at the start of each quarter – was positive entering October, indicating positive prospects for equities in the fourth quarter of 2019.
Timeframe Summary:
In the Secular (years to decades) timeframe (Figs. 1 & 2), the long-term valuation of the market is historically too high to sustain rip-roaring multi-year returns. The Bull-Bear Indicator (months to years) remains positive (Fig. 3), indicating a potential uptrend in the longer timeframe. In the intermediate timeframe, the Quarterly Trend Indicator (months to quarters) is positive for Q4, and the shorter (weeks to months) timeframe (Fig. 4) is positive. Therefore, with three indicators positive and none negative, the U.S. equity markets are rated as Positive.
In the markets:
U.S. Markets: A Friday rally lifted stocks solidly higher for a fourth consecutive week. The large cap S&P 500 index and the technology-heavy NASDAQ Composite reached new intraday and closing highs, while the smaller cap benchmarks remained below their summer highs. The Dow Jones Industrial Average gained 389 points, or 1.4%, to finish the week at 27,347. The NASDAQ added 1.7% and closed at 8,386. By market cap, the large cap S&P 500 rose 1.5%, the S&P 400 midcap index added 1.2%, and the small cap Russell 2000 gained of 2.0%.
International Markets: Canada’s TSX rose for a second week adding 1.2%, while the United Kingdom’s FTSE 100 fell -0.3%. On Europe’s mainland France’s CAC 40 and Germany’s DAX rose 0.7% and 0.5%, respectively. In Asia, China’s Shanghai Composite added 0.1% and Japan’s Nikkei gained 0.2%. As grouped by Morgan Stanley Capital International, developed markets rose 1.5% and emerging markets added 1.2%.
Commodities: Precious metals had a third straight week of gains. Gold rose 0.4% to $1511.40 an ounce, while Silver gained 0.7% finishing the week at $18.05 an ounce. Oil retraced some of last week’s gain, giving up -0.8% and closing at $56.20 per barrel. The industrial metal copper, considered by some analysts a barometer of global economic health due to its wide variety of uses, declined -0.9%.
October Summary: All U.S. market indices gained in October. The Dow Jones Industrials rose 0.5%, the NASDAQ surged 3.7% and the S&P 500 gained 2.0%. The mid cap S&P 400 and small cap Russell 2000 gained 1.0% and 2.6%, respectively. International markets were mixed, but mostly positive. Canada and the United Kingdom gave up -1.1% and -2.2%, respectively, while France and Germany added 0.9% and 3.5%. China added 0.8% while Japan surged 5.4%. Developed markets as a group gained 3.4% and emerging markets as a group added 4.2%. Metal and energy commodities were positive for the month. Gold gained 2.8% and Silver added 6.3% in October, while oil ended the month remarkably flat, rising just 0.2%, and copper finished the month up 2.3%.
U.S. Economic News: The number of Americans seeking first-time unemployment benefits rose slightly last week, but layoffs remained near their lowest levels in half a century. The Labor Department reported initial jobless claims rose by 5,000 to 218,000 last week. Economists had estimated new claims would total a seasonally-adjusted 215,000. The biggest increase in new claims appeared to be in California, where wildfires and power outages kept many people from working. The more stable monthly average of new claims fell by 500, to 214,750. Continuing claims, which counts the number of people already receiving benefits, rose by 7,000 to 1.69 million.
The Non-Farm Payrolls (NFP) report surprised most pundits by reporting that the U.S. economy created 128,000 new jobs in October. Hiring was also stronger at the end of summer than previously reported, the Bureau of Labor Statistics stated. The NFP number easily topped the consensus forecast of 75,000 new jobs. Jobs in leisure and hospitality gained the most, followed by education and health services. The number of jobs in manufacturing contracted the most, most likely caused by the strike at General Motors. The unemployment rate ticked up to 3.6% from 3.5%, but still remains near its lowest level since 1969 and several demographic sub-groups hit their all-time lowest unemployment rate.
The number of home sales in which a contract has been signed, but not yet closed, rose for a second straight month in September, reported the National Association of Realtors (NAR). The NAR stated its pending home sales index climbed 1.5%, helped by lower mortgage rates. Economists had expected just a 0.7% gain. Compared to the same time last year, sales were up by 3.9%. Economists use this number to give an early indication of actual home sales. By region, pending home sales in the Midwest and South showed gains, while the Northeast and West reported declines. Lawrence Yun, Chief Economist for the NAR stated that while the Federal Reserve’s two interest rate cuts this year are helping the housing sector, contract signings would be even higher if more housing was available.
The rate of increase in home prices across the country continued to slow in late summer, according to the latest report from S&P/Case-Shiller. Their 20-city home price index fell 0.2% in August after seasonal adjustments. It was the first decline since last August. Over the past year, the index posted a 2% gain. That number is far below the readings in the 5-6% range prevalent at this time last year. In the details, 17 of the 20 large cities tracked by Case-Shiller posted an increase in home prices, with Phoenix now leading the nation in annual home price gains, up 6.3%. Blerina Uruci, economist at Barclays wrote, “We have seen some stabilization in the Case Shiller index as well as a range of housing activity indicators including home sales and housing starts. As a result, the broader picture suggests that the sector seems on track to stabilize by year-end.”
The confidence of American consumers stabilized in October as trade tensions between the U.S. and China eased and stocks surged. The Conference Board reported its Consumer Confidence Index edged down slightly to 125.9 in October from a revised 126.3 in September. Economists had forecast a reading of 128.0. The index of consumer confidence hit an 18-year high exactly one year ago at 137.9. It’s been up and down since then as the U.S. and China appeared closer to a trade deal and then down when talks fell through. In the report, Americans feel pretty good about the economy right now, but they’re not quite as confident about the future. The so-called present situation index rose to 172.3 from 170.6, but the index that looks at expectations six months from now declined to 94.9 from 96.8. Nonetheless, overall the report was taken as positive. Lynn Franco, director of economic indicators at the privately run Conference Board stated, “Confidence levels remain high and there are no indications that consumers will curtail their holiday spending.”
The Federal Reserve cut interest rates for a third meeting in a row, but Chairman Jerome Powell said in a post-meeting press conference that it would take “material” change in outlook to justify a further rate cut. At its policy meeting this week, Fed officials said they would lower the federal-funds target rate by a quarter percentage point, to between 1.5% and 1.75%. Justifying the move, the Fed cited “the implications of global developments for the economic outlook as well as muted inflation pressures.” In essence, these rate cuts are insurance against a recession. Fed Chairman Jerome Powell said policy would remain steady as long as “incoming information about the economy was broadly consistent” with the Fed’s forecast of moderate economy growth, a strong labor market and inflation near the 2% target. “We believe monetary policy is in a good place to achieve these outcomes,” Powell said. “We see the current stance of policy as likely to remain appropriate as long as incoming information about the economy remains broadly consistent with our outlook.”
International Economic News: The Bank of Canada (BoC) forecast a weaker outlook for the domestic economy amid heightened global downside risks this week. BoC policymakers kept their current 1.75% rate unchanged for an eighth consecutive meeting, calling the level “appropriate” even as they cut their growth forecasts for the next two years. However analysts noted changes to the statement compared with the one from September that suggest officials have become less confident in the face of a weakening global economy. Gone are the statements that reference to Canadian rates being stimulative and the nation’s economy operating close to potential. The central bank “is mindful that the resilience of Canada’s economy will be increasingly tested as trade conflicts and uncertainties persist,” the bank said in its statement.
Britain’s National Institute of Economic and Social Research (NIESR) conjectured that Boris Johnson’s Brexit deal would leave the economy 3.5% smaller in 10 years’ time than if it would have remained in the European Union. NIESR said approval of the prime minister’s deal “would reduce the risk of a disorderly outcome, but eliminate the possibility of a closer trading relationship with the EU”. NIESR noted customs and regulatory barriers would “hinder goods and services trade with the continent leaving all regions of the United Kingdom worse off than they would be if the UK stayed in the EU.” Treasury officials in the UK countered that it plans on a “more ambitious” agreement with the EU than the one “NIESR is basing its findings on”.
The French economy exceeded analysts’ expectations by growing 0.3% in the third quarter, proving more resistant to the global economic slowdown than trade-dependent economies such as Germany and Italy. Economists had expected France’s GDP growth to fall to 0.2% in the third quarter. Florian Hense, an economist at Berenberg, said the structure of the French economy partly insulates it from the global downturn. Exports contribute only 31% of French GDP, versus 48% for the overall Eurozone. France also has a higher share of services, at 70% of its gross value added. “In addition, France is benefiting from good policies at home,” said Hense. “President Emmanuel Macron’s pro-growth reforms are apparently starting to pay off.”
Despite underperforming its neighbors economically, the German stock exchange has outperformed most other European markets this year. The reason for the apparent disconnect is that many of Germany’s major companies have a global footprint that makes them much less dependent on their own domestic market. However, that benefit could fade if the global slowdown worsens into a serious recession. The DAX stock index, up about 24%, is outperforming comparable stock markets in Western economies including the U.S. S&P 500’s 21% gain and the French CAC 40’s 22% increase.
In Asia, more than a third of Chinese provinces fell short of their growth targets as the economy continued to struggle under the weight of domestic structural issues and the repercussions from the trade war with the United States. Official data showed that traditionally poorer regions suffered the most, while the wealthier coastal provinces remained more resilient. China’s southern and most prosperous province last year, Guangdong, grew 6.4% in the first three quarters of 2019, meeting its growth target and slightly exceeding the national rate of 6.2%. In contrast, China’s three northeastern rust belt provinces recorded among the slowest rates of growth. Shao Yu, Orient Securities’ chief economist stated, “The trend [of a widening gap] is inevitable, taking into account the overall economic structural problem … the contrast in growth among the regions will become more obvious.”
Japanese Finance Minister Taro Aso said he saw no need now to implement stimulus measures to prop up Japan’s economy. Aso told reporter after a cabinet meeting that he had “not received instructions” from Prime Minister Shinzo Abe. Analysts have speculated that Abe may ask for additional spending in an extra budget at the end of the year as Japan’s longest postwar economic boom slows amid global trade tensions and a domestic sales tax increase that took effect on October 1. Yasunari Ueno, chief market economist at Mizuho Securities, says the government is likely to earmark $5 billion-$10 billion for infrastructure rebuilding, while longtime Japan strategist Jesper Koll forecasts a much heftier amount, something more like $20 billion-$30 billion.
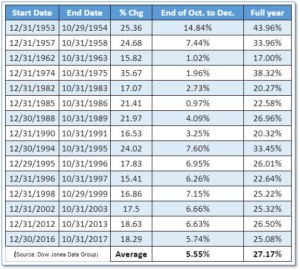
Finally: If a 70-year tendency holds true this year, the balances of Americans’ 401k’s and other investment accounts should be fatter around the New Year. The Dow Jones Data Group analyzed market returns going back to 1950 and found that when the Dow Jones Industrial Average and the S&P 500 index are up a sizable amount at the end of October, as indeed they were this year, positive returns for the rest of the year are in the cards. The authors characterized the gains as “remarkably stellar”. Specifically, when the Dow is up by at least 15% in the year to date through the end of October, the index has been 15-0 for November and December, tacking on an average additional return of 5.55%. The worst gain was +0.97%, the best +14.84%, with most being in the +4% to +6% range. Since the Dow was up 15.9% and the S&P 500 was up 21.2% at the end of this October, the year 2019 is qualified for admission to the party. Of course nothing is guaranteed, but the odds sure are attractive!
(Sources: all index return data from Yahoo Finance; Reuters, Barron’s, Wall St Journal, Bloomberg.com, ft.com, guggenheimpartners.com, zerohedge.com, ritholtz.com, markit.com, financialpost.com, Eurostat, Statistics Canada, Yahoo! Finance, stocksandnews.com, marketwatch.com, wantchinatimes.com, BBC, 361capital.com, pensionpartners.com, cnbc.com, FactSet) Securities offered through Registered Representatives of Cambridge Investment Research Inc., a broker-dealer, member FINRA/SIPC. Advisory Services offered through Cambridge Investment Research Advisors, a Registered Investment Adviser. Strategic Investment Partners and Cambridge are not affiliated.
Indices mentioned are unmanaged and cannot be invested into directly. Past performance is no guarantee of future results. All Investing involves risk. Depending on the types of investments, there may be varying degrees of risk. Investors should be prepared to bear loss, including total loss of principal.