10-4-2021 Weekly Market Update
The very Big Picture
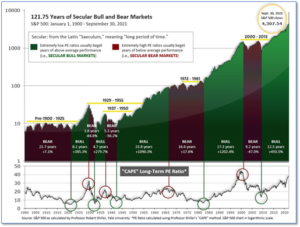
The long-term valuation of the market is commonly measured by the Cyclically Adjusted Price to Earnings ratio, or “CAPE”, which smooths-out shorter-term earnings swings in order to get a longer-term assessment of market valuation. A CAPE level of 30 is considered to be the upper end of the normal range, and the level at which further PE-ratio expansion comes to a halt (meaning that further increases in market prices only occur as a general response to earnings increases, instead of rising “just because”). The market was recently at that level.
Of course, a “mania” could come along and drive prices higher – much higher, even – and for some years to come. Manias occur when valuation no longer seems to matter, and caution is thrown completely to the wind – as buyers rush in to buy first, and ask questions later. Two manias in the last century – the “Roaring Twenties” of the 1920s, and the “Tech Bubble” of the late 1990s – show that the sky is the limit when common sense is overcome by a blind desire to buy. But, of course, the piper must be paid, and the following decade or two were spent in Secular Bear Markets, giving most or all of the mania-gains back.

See Fig. 1 for the 100-year view of Secular Bulls and Bears. The CAPE is now at 37.63, down from the prior week’s 38.48. Since 1881, the average annual return for all ten-year periods that began with a CAPE in the 30-40 range has been slightly negative (see Fig. 2).

Note: We do not use CAPE as an official input into our methods. However, if history is any guide – and history is typically ‘some’ kind of guide – it’s always good to simply know where we are on the historic continuum, where that may lead, and what sort of expectations one may wish to hold in order to craft an investment strategy that works in any market ‘season’ … whether current one, or one that may be ‘coming soon’!
The Big Picture:
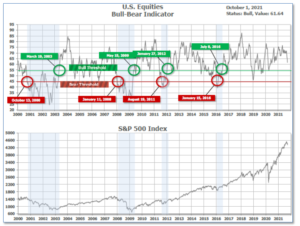
The ‘big picture’ is the (typically) years-long timeframe – the timeframe in which Cyclical Bulls and Bears operate. The U.S. Bull-Bear Indicator is in Cyclical Bull territory at 61.64, down from the prior week’s 65.15.

In the Quarterly- and Shorter-term Pictures
The Quarterly-Trend Indicator based on the combination of U.S. and International Equities trend-statuses at the start of each quarter – was Positive on June 30, indicating positive prospects for equities in the first quarter of 2021.
Next, the short-term(weeks to months) Indicator for US Equities turned positive on September 27 and ended the week at 7, up from the prior week’s 6.

In the Markets:
U.S. Markets: The Dow Jones Industrial Average declined -1.4% closing at 34,326. The technology-heavy NASDAQ declined -3.2% to 14,567. Large caps fell the most this week, with the S&P 500 falling -2.2%. The mid cap S&P 400 closed down -0.6%, while the small cap Russell 2000 declined -0.3%.
International Markets: International markets were a sea of red for the week. Canada’s TSX declined -1.2%, while the United Kingdom’s FTSE 100 ticked down -0.3%. On Europe’s mainland, France’s CAC 40 shed -1.8% and Germany’s DAX declined -2.4%. In Asia, China’s Shanghai Composite closed down -1.2% and Japan’s Nikkei plunged ‑4.9%. As grouped by Morgan Stanley Capital International developed markets declined -2.6%, while emerging markets gave up -0.9%.
Commodities: Precious metals finished the week up. Gold rose 0.4% to $1758.40 per ounce, while Silver gained 0.5% to $22.54. Energy continued to rise, now for six consecutive weeks. West Texas Intermediate crude oil gained 2.6% to $75.88 per barrel. The industrial metal copper, viewed by some analysts as a barometer of world economic health due to its wide variety of uses, finished the week down -2.3%.
September and Q3 Summary: All the major U.S. indexes finished the month of September to the downside. The Dow retreated -4.3% and the NASDAQ shed -5.3%. Large caps fell -4.8%, while mid caps and small caps declined -4.1% and ‑3.1%, respectively. In the third quarter, the Dow ended down -1.9% and the NASDAQ declined -0.4%. Large caps finished up 0.2%, but mid caps gave up -2.1%. Small caps were the biggest losers in the 3rd quarter ending the period down ‑4.6%.
In September, Canada and the UK fell -2.5% and -0.5% respectively, while France declined -2.4% and Germany shed ‑3.6%. On the other hand, September was a good month for Asian markets. China ended the month up 0.7%, while Japan powered ahead 4.9%. For the month, Emerging markets declined -3.9% and Developed markets gave up -3.3%. In the third quarter, Canada declined ‑0.5%, while the UK rose 0.7%. France ticked up 0.2%, but Germany declined ‑1.7%. China closed down ‑0.6%, while Japan managed a 2.3% gain. For the quarter, Developed markets retreated -1.1% and Emerging markets dropped a sizable ‑8.6%.
Gold and Silver declined -3.4% and -8.2% respectively in September, Oil surged 9.5% and Copper finished the month down -6.5%. In the third quarter, Gold ticked down -0.8%, while Silver plunged -15.8%. Oil rose 2.1% and copper declined -4.7%.
U.S. Economic News: The number of Americans filing first-time claims for unemployment jumped last week, hitting a two-month high. The Labor Department reported new claims rose by 11,000 to 362,000 in the week ended September 25th. Economists had expected claims to total just 330,000. Claims jumped the most in California, up by almost 18,000 to 86,792. That state is still working through a large backlog of applications that had yet to be processed. Claims fell in 35 other states. Meanwhile, the number of people already collecting benefits, known as “continuing claims”, dropped by 18,000 to 2.8 million. That number remains near a pandemic low.
After two months of declines, the number of Americans who signed contracts to purchase homes jumped last month, far exceeding economists’ expectations. The National Association of Realtors (NAR) reported pending home sales rose 8.1% in August compared with July. Economists had expected just a 0.4% increase. Still, compared with the same time last year, pending sales were down -8.3% reflecting how much home-buying activity has fallen from late last summer. Every region saw home sales increase on a monthly basis, led by a 10.4% gain in the Midwest. The pending home sales index measures real-estate transactions where a contract was signed but not yet closed.
Home prices rose at a record pace for a fourth consecutive month, rising in virtually every major metropolitan area across the nation. The latest edition of the S&P CoreLogic Case-Shiller Home Price Index showed home prices soared 19.7% from the same time last year. The separate 20-city index, which measures price appreciation among a group of major metropolitan areas across the country, saw a 19.9% year-over-year gain. The three cities to see the largest annual gains remained the same — Phoenix (32.4%), San Diego (27.8%) and Seattle (25.5%). “The last several months have been extraordinary not only in the level of price gains, but in the consistency of gains across the country,” said Craig J. Lazzara, managing director and global head of index investment strategy at S&P DJI, in the report.
The rapid increase in prices isn’t just confined to the real estate sector. The Bureau of Economic Analysis reported this week the cost of goods and services rose sharply again in August putting the inflation rate in the U.S. at a 30-year high. The Personal Consumption Expenditures Index climbed 0.4% in August, its sixth consecutive increase. The rate of inflation over the past 12-months ticked up to 4.3%–the highest it has been since 1991. A separate measure of inflation that strips out volatile food and energy prices rose 0.3% in August. It’s known as the core rate and is viewed by the Fed as a more reliable barometer of inflationary trends. The increase in the core rate over the past 12 months was unchanged at 3.6%, also at a 30-year peak.
Confidence among the nation’s consumers fell for a second month hitting a 7-month low as media reports of a “delta-variant” of the coronavirus and inflation worries weighed on sentiment. The Conference Board reported its closely followed index of consumer confidence slid to 109.3 this month, down 5.9 points from August. Economists had expected a reading of 115.3. Worries about inflation remain high and analysts believe consumers are putting off big purchases because of the higher prices. Furthermore, consumers don’t expect things to improve anytime soon. The part of the survey that assesses how Americans view the next six months was weaker. The so-called “future expectations index” slid 6.2 points to 86.6—its lowest level since January.
Orders for goods expected to last at least three years, so-called “durable goods”, jumped last month and the government revised July’s report to show a significant increase in orders instead of a decline. The Census Department reported orders for durable goods jumped 1.8% last month. Economists had expected just a 0.6% increase. However, analysts noted the big increase was in large part due to a surge in orders for Boeing 737 Max jets and other aircraft. Orders for new commercial airplanes soared 78% in August and drove most of the increase in bookings for U.S.-made durable goods. If transportation is excluded, bookings were up just 0.2%. As has been the case, the biggest problem for manufacturers remains getting critical supplies and finding skilled workers willing to work. Business investment remained robust. Investment rose 0.5% in August and increased for the sixth month in a row. Analysts remain optimistic. Chief economist Rubeela Farooqi of High Frequency Economics wrote in a note, “Momentum is still positive for now.”
A measure of business conditions in the Chicago area slipped to its lowest level in seven months. The Chicago area Purchasing Managers’ Index (or PMI) slowed to 64.7 in September, from 66.8 the prior month. Economists had forecast a reading of 64.3. Still, despite the decline analysts stated activity remains robust. Josh Shapiro, chief U.S. economist at MFR Inc wrote in a note, “Recent results from this survey are very strong and are indicative of solid ongoing growth in economic activity.” Respondents to the survey reported that now freight/shipping difficulties in addition to shortages of supplies of raw materials hampered production.
The international trade deficit rose again as retailers continued to import more consumer goods for the holiday shopping season. The trade gap in goods widened 0.9% to $87.6 billion in August, the government reported this week. Goods imports increased 0.8% to $236.6 billion, just below the all-time high set in June. Meanwhile, U.S. exports moved up 0.7% to $149 billion to set a new record.
International Economic News: The Fraser Institute, an independent public policy think-tank in Canada, reported economic growth and business investment in Canada have been faltering. The decline has severely weakened the country’s ability to encourage innovation or new business start-ups, the study found. Philip Cross, senior fellow at the Fraser Institute wrote in the report, “Canada’s sluggish economic growth in the years before the pandemic reflects a lack of innovation and weak productivity growth.” The study finds that Canada’s economic growth (measured by GDP, adjusted for inflation) over the past decade was the slowest since the 1930s, with productivity stalled and reduced competitiveness that impaired the country’s attractiveness for investment. Furthermore, the study asserted that businesses in Canada are hampered by overbearing regulations with much of the economy based on limiting competition rather than fostering competitive markets.
Across the Atlantic, Britain’s economy grew by more than previously thought in the April to June period before a sharp slowdown that occurred at the beginning of this quarter. The United Kingdom’s Office for National Statistics reported the country’s Gross Domestic Product increased by 5.5% in the second quarter—stronger than the preliminary estimate of 4.8%. The revision means Britain is no longer the worst-performing economy among Group of Seven developed countries, when comparing GDP in the summer of 2021. It is now tied with Germany and above Italy. This week, Bank of England Governor Andrew Bailey said he thought the economy would regain its pre-pandemic level of output in early 2022.
On Europe’s mainland, consumer prices in France accelerated to the highest level in about a decade as households faced a jump in the cost of energy. Consumer prices in France rose 2.7% from the same time last year—almost entirely due to the increase in energy prices. Despite the surge, European Central Bank President Christine Lagarde said the stronger inflation numbers were “largely transitory”, echoing comments made by Federal Reserve Chair Jerome Powell. Bank of France Governor Francois Villeroy de Galhau has been equally optimistic, saying earlier this week that while tensions on some prices are undeniable, these are temporary and associated with the strong economic recovery in Europe.
In Germany, often referred to as Europe’s economic powerhouse, business leaders voiced relief after the country’s federal election results quashed the possibility of the next government having a strong left-leaning slant. Angela Merkel’s Christian Democratic Union party experienced a landslide defeat losing about a quarter of its vote share and ending in third place in three of the eastern states of Germany, behind the Social Democrats and the rightwing populist AfD. The Social Democrats, largely written off as a serious contender for the election only six months ago, saw a remarkable comeback, finishing first in the popular vote and gaining substantial support in the eastern states.
In Asia, factories in China were already struggling when the world’s second largest economy had to contend with yet another concern—a growing power supply crunch. A government survey of manufacturing activity fell to 49.6 in September, down from 50.1 in August. Readings below 50 indicate contraction. Local Chinese authorities have abruptly ordered power cuts at many factories in the last week. In mid-August, China’s economic planning agency announced that 20 regions—accounting for about 70% of China’s GDP per Nomura—failed to meet carbon-related targets, prompting local authorities to take action.
Bank of Japan Governor Haruhiko Kuroda stated Japan’s economy will continue to recover and could reach levels seen before the coronavirus pandemic by the end of this year or early in 2022. However, with consumption weak and inflation well below its 2% target the BOJ will maintain its massive stimulus “regardless of the new government’s policies”, Kuroda said. Japan’s ruling party anointed former foreign minister Fumio Kishida as its new leader. Kuroda offered an upbeat view on Japan’s economy, saying that steady progress on vaccinations and an end to state-of-emergency curbs to combat the pandemic are likely to lead to a recovery in consumption in the coming months.
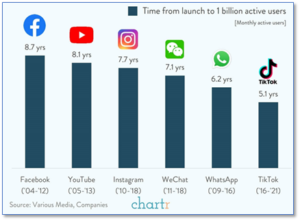
Finally: Initially released just five years ago, video-sharing app TikTok announced this week that the company has hit one billion active users. The billion-user club is very small, with the likes of Facebook, YouTube and Instagram. However, no member of the billion-user club has achieved that status in such a short time as TikTok – just 5 years! This is significantly shorter than the time it took the others to join the club…and works out to an average 16,666,667 new users every single month for the last 5 years. (Chart from chartr.co)

(Sources: All index- and returns-data from Yahoo Finance; news from Reuters, Barron’s, Wall St. Journal, Bloomberg.com, ft.com, guggenheimpartners.com, zerohedge.com, ritholtz.com, markit.com, financialpost.com, Eurostat, Statistics Canada, Yahoo! Finance, stocksandnews.com, marketwatch.com, wantchinatimes.com, BBC, 361capital.com, pensionpartners.com, cnbc.com, FactSet.) Securities offered through Registered Representatives of Cambridge Investment Research Inc., a broker-dealer, member FINRA/SIPC. Advisory Services offered through Cambridge Investment Research Advisors, a Registered Investment Adviser. Strategic Investment Partners and Cambridge are not affiliated. Indices mentioned are unmanaged and cannot be invested into directly. Past performance is no guarantee of future results.
