
10-18-21 Weekly Market Update
The very Big Picture
The long-term valuation of the market is commonly measured by the Cyclically Adjusted Price to Earnings ratio, or “CAPE”, which smooths-out shorter-term earnings swings in order to get a longer-term assessment of market valuation. A CAPE level of 30 is considered to be the upper end of the normal range, and the level at which further PE-ratio expansion comes to a halt (meaning that further increases in market prices only occur as a general response to earnings increases, instead of rising “just because”). The market is now above at that level.
Of course, a “mania” could come along and drive prices higher – much higher, even – and for some years to come. Manias occur when valuation no longer seems to matter, and caution is thrown completely to the wind – as buyers rush in to buy first, and ask questions later. Two manias in the last century – the “Roaring Twenties” of the 1920s, and the “Tech Bubble” of the late 1990s – show that the sky is the limit when common sense is overcome by a blind desire to buy. But, of course, the piper must be paid, and the following decade or two were spent in Secular Bear Markets, giving most or all of the mania-gains back.
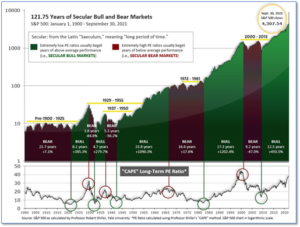
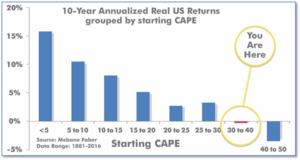
See Fig. 1 for the 100-year view of Secular Bulls and Bears. The CAPE is now at 38.08, up from the prior week’s 37.93. Since 1881, the average annual return for all ten-year periods that began with a CAPE in the 30-40 range has been slightly negative (see Fig. 2).
Note: We do not use CAPE as an official input into our methods. However, if history is any guide – and history is typically ‘some’ kind of guide – it’s always good to simply know where we are on the historic continuum, where that may lead, and what sort of expectations one may wish to hold in order to craft an investment strategy that works in any market ‘season’ … whether current one, or one that may be ‘coming soon’!
The Big Picture:
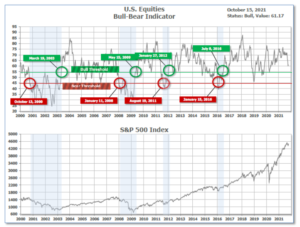
The ‘big picture’ is the (typically) years-long timeframe – the timeframe in which Cyclical Bulls and Bears operate. The U.S. Bull-Bear Indicator is in Cyclical Bull territory at 61.17, up from the prior week’s 60.10.
In the Quarterly- and Shorter-term Pictures
The Quarterly-Trend Indicator based on the combination of U.S. and International Equities trend-statuses at the start of each quarter – was Positive on June 30, indicating positive prospects for equities in the first quarter of 2021.
Next, the short-term(weeks to months) Indicator for US Equities turned positive on September 27 and ended the week at 10, up from the prior week’s 7.
In the Markets:
U.S. Markets: U.S. stocks built on the previous week’s gains, helped by some strong economic reports and positive earnings surprises. All of the major indexes finished solidly in the green. The Dow Jones Industrial Average rose 1.6% to finish the week at 35,295. The technology-heavy NASDAQ Composite rebounded 2.2%, closing at 14,897. By market cap, the large cap S&P 500 gained 1.8%, while the mid cap S&P 400 and small cap Russell 2000 finished up 2.2% and 1.5%, respectively.
International Markets: International markets also finished the week solidly to the upside. Canada’s TSX rallied 2.5% along with the United Kingdom’s FTSE 100, which added 2%. France’s CAC 40 and Germany’s DAX gained 2.6% and 2.5%, respectively. In Asia, China’s Shanghai Composite declined -0.6%, but Japan’s Nikkei surged 3.6%. As grouped by Morgan Stanley Capital International, developed markets rose 2.6% while emerging markets gained 2.2%.
Commodities: Commodities also participated in this week’s buying. Gold and Silver finished the week in the green with Gold rising 0.6% to $1768.30 per ounce, and Silver gaining 2.8% to $23.35. West Texas Intermediate crude oil continued its march higher rising 3% to $81.73 per barrel—its eighth consecutive week of gains. The industrial metal copper surged 10.6%.
U.S. Economic News: The number of Americans filing for first-time unemployment benefits fell below 300,000 for the first time since the pandemic began. Just 293,000 applied for jobless benefits last week, a decline of 36,000 from the previous week. Economists had expected claims to total 318,000. Meanwhile, continuing claims, which counts the number of people already receiving benefits, fell by 134,000 to 2.59 million. Continuing claims is also at a pandemic low. Most economists expect the employment trend to continue. Corporate economist Robert Frick of Navy Federal Credit Union wrote in a note, “Hopefully, we can quickly resume dropping to the pre-Covid era average of about 200,000.”
A record number of workers quit their jobs in August, signaling more trouble ahead for businesses already struggling to fill roughly 10 million open jobs. The Bureau of Labor Statistics reported the number of U.S. job openings fell in August, but even more concerning was the record number of people outright leaving their jobs. The so-called ‘quits rate’ climbed to 2.9% overall and 3.3% for private-sector employees. Both are at their highest level since the government began tracking the data in 2000. Altogether, a record 4.27 million people quit their jobs in August. Meanwhile, the number of job openings across the country fell to 10.4 million in August from a record 11.1 million in July.
The nation’s small businesses reported a pick-up in demand, but shortages of supplies and skilled labor continue to weigh on growth. The National Federation of Independent Business (NFIB) reported its index slipped a point to 99.1 in September—its lowest reading in six months. Small businesses report they cannot find enough skilled workers even after raising pay. More than 50% of small businesses said they couldn’t fill open positions last month, a 48-year peak. And the number of companies offering higher pay was also at a 48-year high. The situation doesn’t appear likely to get better anytime soon. In addition to labor and supply shortages, small business owners now have to worry about government interference. NFIB chief economist Bill Dunkelberg stated, “The outlook for economic policy is not encouraging to owners, as lawmakers shift to talks about tax increases and additional regulations.”
Business conditions in the New York-region moderated this month according to the New York Federal Reserve. The NY Fed’s Empire State Business Conditions index fell 14.5 points to 19.8 in October. Economists had expected a reading of 25. The new-orders index slipped 9.4 points to 24.3 and the shipments index sank 18 points to 8.9. Despite the lower readings, respondents stated they were more optimistic about business conditions for the next six months.
In a surprise to absolutely no one, prices at the consumer level continued to increase in September keeping the rate of inflation at a 30-year peak. The Bureau of Labor Statistics reported its ‘consumer price index’ (CPI) climbed 0.4% last month. Higher prices for food, gasoline, and rent drove the advance. Economists had expected a 0.3% rise. The pace of annual inflation over the past year edged up to 5.4% in September, more than double the Federal Reserve’s 2% target. Core CPI, which omits the often-volatile food and energy categories, rose 0.2% last month. The 12-month increase in the core rate was unchanged at 4%. It had reached a 30-year high of 4.3% in June. Most economists outside of the Federal Reserve have given up the belief inflation will be ‘transitory’. Senior economist Ben Ayers at Nationwide wrote in a note, “Extended supply chain disruptions —and potentially further increases in energy costs — are likely to maintain a hot inflation trend through yearend and into 2022 even as pandemic effects slowly ebb.”
At the wholesale level, inflation rose at its slowest pace in nine months, but all is not good under the surface. The producer price index climbed 0.5% last month—its smallest gain since December, and a tick below expectations. Yet the details showed a steep drop in airline fares and an unusual decline in transportation and warehousing costs held down overall producer prices. However, with ports backed up, truckers hard to find, and limited space on rail cars, analysts view that decline as an anomaly. Over the past 12 months, wholesale inflation rose to 8.6%. That’s the highest level since the index was reconfigured in 2010—and likely one of the highest readings since the early 1980’s.
According to minutes of the Federal Reserve’s Sept. 21-22 policy meeting, officials discussed a plan to begin to slow down emergency support for the economy in either mid-November or December. Fed officials discussed when to slow down the current pace of $120 billion per month in purchases of Treasury and mortgage-backed securities (MBS) that has been underway since June 2020. The minutes show officials discussed “an illustrative plan” to reduce the asset purchases by $15 billion per month – specifically cutting purchases of Treasuries by $10 billion and MBS purchases by $5 billion. “Several” Fed officials said they preferred to proceed at a more rapid pace. Economists expect the Fed to announce a specific plan to taper at the end of its Nov. 2-3 meeting.
International Economic News: Like much of the world, Canada is also concerned about its supply chains. Speaking to reporters after meetings with the World Bank and International Monetary Fund, Finance Minister Cynthia Freeland said she was broadly optimistic about the strength of Canada’s economic recovery, but the rebound in demand for goods has exposed supply chain shortages. “We are definitely mindful of the supply chain issues in the Canadian economy. We are monitoring the supply chain and Canadian ports, very, very closely,” she said.
Like on the west coast of the United States a log jam at the United Kingdom’s busiest commercial port ratcheted up concerns that the country could see shortages over the Christmas holiday season. The disruption is clearly visible at the east England port of Felixstowe, the U.K.’s largest commercial port. A bottleneck of containers at the port, which deals with 36% of U.K. freight container volumes, has been blamed on a shortage of drivers. Alex Hersham, chief executive of London-based Zencargo wrote in a note, “With Felixstowe handling almost 40% of all the containers coming to and from the U.K., this adds yet more imbalance to Britain’s supply chain, especially in the current peak consumer period we are entering ahead of Christmas.”
On Europe’s mainland, French president Emmanuel Macron has outlined a five-year 30 billion euro investment plan to boost the country’s high-tech industries and reduce dependence on imported raw materials and electronic components. Six months before a presidential election in which he is expected to seek a second term, Macron said the “France 2030” plan would direct government money to 10 targets, including the development of small “modular” nuclear reactors, “low-carbon” aircraft and green hydrogen production among other things. “We need to reinvest in a strategy of growth,” Macron said. “If we don’t reindustrialize the country, we cannot again become a nation of innovation and research.”
The top European economic institutes slashed their growth forecasts for Germany, Europe’s largest economy. In a joint statement, the five economic institutes — DIW, Ifo, IfW, IWH and RWI, cut their growth forecast for Germany to just 2.4% this year—a decline of 1.3% from their previous estimate. They cited continued supply chain issues as the main reason for the downgrade. Production lines at major German automobile companies such as Volkswagen and Opel have been slowed down due to a lack of semiconductors, for example. However, at the same time the institutes raised their growth forecasts for next year to 4.8% from 3.9%. Stefan Kooths, a research director at the Kiel Institute for the World Economy (IfW), said the economy would reach its “pre-crisis level” in the first quarter of 2022.
In Asia, most major international investment banks have cut their growth forecasts for China ahead of China’s quarterly growth numbers due out early next week. Out of 13 major banks, 10 have cut their growth forecasts for August. The median prediction is growth of 8.2% this year—down 0.3% from the prior forecast. Japanese investment bank Nomura has lowest full-year forecast at 7.7%, while Southeast Asia’s largest bank DBS has the highest at 8.8%. Economists pointed to slower-than-expected consumer spending, natural disasters, and Beijing’s regulatory crackdowns as reasons for the lowered forecasts.
Kozo Yamamoto, a senior ruling party official close to Japanese Prime Minister Fumio Kishida, said Japan must compile an economic stimulus package worth at least 32-33 trillion yen ($282-290 billion USD) to cushion the impact of the coronavirus pandemic. The funds are needed to fill Japan’s output gap and achieve the central bank’s 2% inflation target. A former finance ministry official, Yamamoto has been deeply involved in the creation of “Abenomics”, a mix of massive monetary and fiscal stimulus and a growth strategy deployed in 2013 to pull Japan out of economic stagnation.
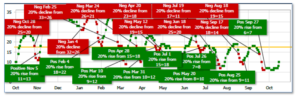
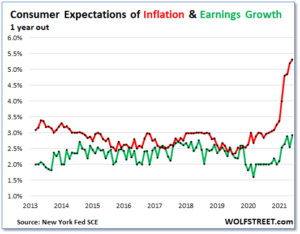
Finally: As prices continue to march higher for food, gas, and just about everything else, everyday people are beginning to realize that maybe inflation won’t be as ‘transitory’ as the Federal Reserve continues to assert. According to the New York Fed’s Survey of Consumer Expectations, inflation expectations for three years from now jumped to 4.2% – the highest level in the survey dataset – and to 5.3% for one year out. But expectations for income growth are way behind expected inflation, at just 2.9%. If these expectations come true, Americans will be forced into a lower standard of living as expenses outrun incomes. (Chart from Wolfstreet.com)
(Sources: All index- and returns-data from Yahoo Finance; news from Reuters, Barron’s, Wall St. Journal, Bloomberg.com, ft.com, guggenheimpartners.com, zerohedge.com, ritholtz.com, markit.com, financialpost.com, Eurostat, Statistics Canada, Yahoo! Finance, stocksandnews.com, marketwatch.com, wantchinatimes.com, BBC, 361capital.com, pensionpartners.com, cnbc.com, FactSet.) Securities offered through Registered Representatives of Cambridge Investment Research Inc., a broker-dealer, member FINRA/SIPC. Advisory Services offered through Cambridge Investment Research Advisors, a Registered Investment Adviser. Strategic Investment Partners and Cambridge are not affiliated. Indices mentioned are unmanaged and cannot be invested into directly. Past performance is no guarantee of future results.