
10-30-2023 Weekly Market Update
The very Big Picture
The long-term valuation of the market is commonly measured by the Cyclically Adjusted Price to Earnings ratio, or “CAPE”, which smooths-out shorter-term earnings swings in order to get a longer-term assessment of market valuation. A CAPE level of 30 is considered to be the upper end of the normal range, and the level at which further PE-ratio expansion comes to a halt (meaning that further increases in market prices only occur as a general response to earnings increases, instead of rising “just because”). The market was recently above that level and has fallen back.
Of course, a “mania” could come along and drive prices higher – much higher, even – and for some years to come. Manias occur when valuation no longer seems to matter, and caution is thrown completely to the wind – as buyers rush in to buy first, and ask questions later. Two manias in the last century – the “Roaring Twenties” of the 1920s, and the “Tech Bubble” of the late 1990s – show that the sky is the limit when common sense is overcome by a blind desire to buy. But, of course, the piper must be paid, and the following decade or two were spent in Secular Bear Markets, giving most or all of the mania-gains back.
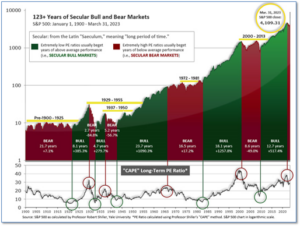
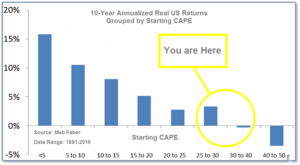
See Fig. 1 for the 100-year view of Secular Bulls and Bears. The CAPE is now at 28.14, down from the prior week’s 28.87. Since 1881, the average annual return for all ten-year periods that began with a CAPE in this range has been slightly positive to slightly negative (see Fig. 2).
Note: We do not use CAPE as an official input into our methods. However, if history is any guide – and history is typically ‘some’ kind of guide – it’s always good to simply know where we are on the historic continuum, where that may lead, and what sort of expectations one may wish to hold in order to craft an investment strategy that works in any market ‘season’ … whether the current one, or one that may be ‘coming soon’!
The Big Picture:
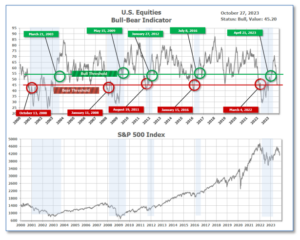
The ‘big picture’ is the (typically) years-long timeframe – the timeframe in which Cyclical Bulls and Bears operate. The U.S. Bull-Bear Indicator finished the week in Bull territory at 45.20 down from the prior week’s 48.30. (see Fig. 3)
In the Quarterly- and Shorter-term Pictures
The Quarterly-Trend Indicator based on the combination of U.S. and International Equities trend-statuses at the start of each quarter – was Positive entering July, indicating positive prospects for equities in the third quarter.
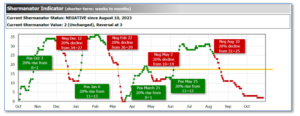
Next, the short-term(weeks to months) Indicator for US Equities turned negative on August 10, and ended the week at 2, unchanged from the prior week.
In the Markets:
U.S. Markets: The major indexes finished the week to the downside, as mixed corporate earnings reports and concerns about higher interest rates dented market sentiment. The yield on the benchmark 10-year U.S. Treasury note breached the 5% level for the first time in 16 years. The Dow Jones Industrial Average shed 710 points, finishing the week at 32,418, a loss of -2.1%. The technology-heavy NASDAQ Composite gave up -2.6% to 12,643. By market cap, the large cap S&P 500 fell by -2.5%, while the mid cap S&P 400 retreated -2.8%. The small cap Russell 2000 ended the week down -2.6%.
International Markets: International indexes finished the week primarily to the downside as well. Canada’s TSX fell -2.0%, while the United Kingdom’s FTSE 100 dropped by -1.5%. On Europe’s mainland, France’s CAC 40 and Germany’s DAX pulled back by -0.3% and -0.8% respectively. In Asia, China’s Shanghai Composite gained 1.2%. Japan’s Nikkei fell by -0.9%. As grouped by Morgan Stanely Capital International, developed markets retreated -1.1%. Emerging markets ticked down -0.7%
Commodities: Precious metals finished the week mixed as Gold rose 0.21% to $1998.50 per ounce, while Silver fell -2.63% to $22.89 per ounce. Oil finished the week to the downside as well. West Texas Intermediate crude oil closed at $85.54 per barrel, a drop of -2.9%. The industrial metal copper, viewed by some analysts as a barometer of world economic health due to its wide variety of uses, ended the week up 2.3%.
U.S. Economic News: A pair of S&P surveys showed that the U.S. economy is off to a good start in the fourth quarter. The S&P flash U.S. services-sector index rose to a three-month high of 50.9 and the S&P U.S. manufacturing-sector index climbed to a six-month high of 50. Readings above 50 signal expansion. Surveys from earlier this year reported economic weakness, but the recent upswing is a positive sign. The S&P surveys have “been among the most downbeat economic indicators in recent months, so the upturn in U.S. output growth signaled at the start of the fourth quarter is good news,” said Chris Williamson, chief business economist at S&P Global Market Intelligence.
U.S. new-home sales surged to their highest level since February 2022. New residential sales rose by 12.3% to an annual rate of 759,000 in September, the Commerce Department reported. The pace exceeded economists’ expectations of 680,000. All regions reported a rise in the rate of new home sales. There was a sharp increase in the Midwest, but the Northeast posted the largest gains of 22.5%. The median sales price of a new home sold dropped from $430,300 to $418,800 last quarter. Compared to 2022, new home sales are up 33.9%. “New home sales defied gravity in September,” Neil Dutta, head of economics at Renaissance Macro Research, wrote in a note. “It is remarkable we’re seeing this sort of activity with rates where they are,” Dutta added.
GDP surged 4.9% in the third quarter, fueled by a burst in consumer spending. The primary engine of U.S. growth, consumer spending, rose by 4% between July and September. Americans spent more on new cars, consumer electronics, and services such as travel and recreation, while companies increased production and replenished depleted inventories. Government spending rose largely in defense-related purchases as geopolitical tensions heightened. Total government spending added 0.8 percentage points to GDP. Many economists expect economic growth to remain weak due to rising interest rates. Higher borrowing costs tend to depress the economy. “This was a very strong report, no doubt about it. That said, it’s not likely to be sustainable,” said senior economist Sam Bullard of Wells Fargo. “We are not looking for this rate of growth to repeat in the fourth quarter,” he added.
Jobless claims ticked up this month but remained in low territory. The Labor Department reported that initial jobless claims grew by 10,000 to 210,000. Economists expected the claims would rise by 9,000 to 207,000. Meanwhile, the number of people already collecting jobless benefits, known as “continuing claims”, rose by 63,000 to 1.79 million, marking its fifth consecutive increase since May. The rise in continued claims suggests that the hiring rate is slowing down. “The continuing claims numbers signal a softening in labor demand. If the number of workers staying on government support grow going forward, they will be unable to find other jobs as quickly,” said Rubeela Farooqi, chief U.S. economist at High Frequency Economics.
Durable goods orders jumped primarily due to an increase in aircraft purchasing contracts. Orders for commercial planes rose 93% in September, lifting overall goods orders by 4.7%. Transportation tends to exaggerate the ups and downs in the durable-goods report. Omitting airplanes and cars, new orders rose just 0.5%, which was in line with economists’ expectations. Core orders increased 0.6%. Overall business investment rose strongly for the second consecutive month. The industrial side of the economy showed signs of improvement, but economists are expecting higher borrowing costs to drag down investments. Senior economist at BMO Capital Markets, Jay Hawkins said, “The underlying details weren’t as strong as the headline upturn suggests, but broad-based increases in new orders point to a possible bottoming in the manufacturing sector and rebound in business equipment spending in the last quarter of 2023.”
Pending-home sales remained near a record low, despite a slight pickup in September. High mortgage rates and low inventory continued to weigh down the real-estate sector. According to the monthly index released by the National Association of Realtors (NAR), pending home sales rose 1.1% last month. This marked the second-lowest reading since the NAR began tracking the data in 2001. In the NAR’s forecast for existing-home sales, the group expects sales to fall 17.5% this year, to a pace of 4.15 million, which would mark its slowest rate since the Great Recession in 2008. “Because of homebuilders’ ability to create more inventory, new-home sales could be higher this year despite increasing mortgage rates,” NAR Chief Economist Lawrence Yun said. “This underscores the importance of increased inventory in helping to get the overall housing market moving,” said Yun.
Inflation measured by the Personal Consumption Expenditures (PCE) price index rose by 0.4% for the second month in a row. Over the course of 2023, the index has risen by 3.4%, which exceeds the Federal Reserve’s 2% target. Economists say that the increase in inflation last month may persuade the Fed to raise interest rates next week. “Inflation should continue to decline as the labor market softens somewhat and wage pressures abate,” said chief economist Gus Faucher of PNC Financial Services. “If there is a recession, inflation should be back at the Fed’s 2% objective by this time next year. But if economic growth slows, but does not falter, then inflation will not get back to 2% until late 2024 or early 2025,” he added.
International Economic News: The Bank of Canada decided to hold its key overnight interest rate at 5%, saying that price risks were on the rise. The central bank held rates at a 22-year high, but left the door open to more hikes. While inflation is expected to return to the 2% target by the end of 2025, the central bank forecasted that inflation would decline to 2.5% by the second quarter of 2024. “Progress towards prices stability is slow and inflationary risks have increased,” the central bank wrote in a statement. The risks cited in the statement included oil prices and geopolitical uncertainty arising from the war in Israel and Gaza. “The Bank of Canada delivered a hawkish hold as expected, but it was slightly more hawkish than I had expected going into it,” said Derek Holt, head of capital markets economics at Scotiabank. Economists forecasted that the central bank would hold the rates at 5% for at least six months. BoC Governor Tiff Macklem said, “The path to a soft landing is narrow, and in this projection, that path has gotten narrower.”
The British economy lost jobs in the third quarter, marking its largest employment drop since 2021. Employment continued its downward streak, losing 82,000 jobs between June and August. The central bank forecasted the jobless rate to reach 5% in 2026, while increased interest rates slow consumer demand. “Growing the economy is our priority. That’s why we are bearing down on inflation and bringing in the next generation of welfare reforms to drive down inactivity and help more people into work,” said Mel Stride, Secretary of State for Work and Pensions. British businesses reported higher levels of pessimism, which prompted hiring freezes and staff cuts, according to S&P Global. Economists are concerned that the rise in unemployment, living costs, and interest rates may tip the economy into a recession. “Gloom about the outlook has intensified in the uncertain economic climate, boding ill for output in the coming months,” Chris Williamson, chief business economist at S&P Global Market Intelligence wrote in a report. “A recession, albeit only mild at present, cannot be ruled out,” Williamson added.
The euro zone entered the fourth quarter on the wrong foot as business activity dropped off this month. Europe’s largest economy, Germany, contracted for the fourth consecutive month as the downturn in manufacturing matched a renewed decline in services. Business activity in France declined as well. The Composite Purchasing Managers’ Index (PMI), compiled by S&P Global, fell from 47.2 to 46.5 in October, which marked its lowest reading since 2020. European Central Bank President Christine Lagarde’s ‘higher-for-longer’ interest rate narrative may not last as long as some expect. As the PMI remained below the 50-level determining growth in activity, economists warned the EU may slip into recession. “The flash PMIs mark a poor start to October for the euro zone, especially after showing some early signs of recovery in September,” said Rory Fennessy at Oxford Economics. “If this trend continues, this poses downside risks to our stagnant growth forecast for Q4,” Fennessy added.
China’s robust industrial profits boosted gains for the second month in September. Industrial profits rose 7.7% in the last quarter, NBS statistician Yu Weining wrote in a statement. Industrial profit numbers cover firms with annual revenues of at least 20 million yuan ($2.73 million) from their main operations. Analysts attribute the rise in industrial profits to policy measures rolled out over the last few months. However, the crisis-hit property sector continued to weigh down China’s economic activity and corporate earnings. “Producer prices dropped last month, an indication that industrial firms cut prices to promote sales and dragged industrial revenues and profits,” said Zhou Maohua, an analyst at China Everbright Bank.
Japanese Prime Minister Fumio Kishida pledged to compensate households for increased cost of living expenses. Fueled by rising raw material costs, inflation remained above the central bank’s 2% target and weighed down consumption. Consumer purchasing power fell an annualized 2.5% in August, despite the inflation adjusted real wages delivered by large firms. As rising prices persistently outpaced salary growth, Kishida pledged to return some of the expected increase in tax revenues, generated by solid economic growth, back to households. “To ensure this change takes hold, we must achieve sustained, structural wage increases and promote investment through private-public cooperation,” Kishida stated.
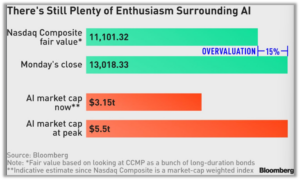
Finally: Investors are assigning a market value of over $3 trillion to the artificial-intelligence industry. Of the more than 3,000 stocks comprising the Nasdaq Composite Index, the aggregate fair valuation is 11,101. The index closed at 13,018, meaning stocks are overvalued by 1,917 points or $3.1 trillion in market capitalization. At its peak, investor avidity for artificial intelligence propelled the Nasdaq Composite to 14,447, a market capitalization of about $5.5 trillion to the AI complex. In the wake of geopolitical tensions, investors have since trimmed their positions. However, plenty of froth remains in the market to be mopped up.
(Sources: All index- and returns-data from Norgate Data and Commodity Systems Incorporated; news from Reuters, Barron’s, Wall St. Journal, Bloomberg.com, ft.com, guggenheimpartners.com, zerohedge.com, ritholtz.com, markit.com, financialpost.com, Eurostat, Statistics Canada, Yahoo! Finance, stocksandnews.com, marketwatch.com, wantchinatimes.com, BBC, 361capital.com, pensionpartners.com, cnbc.com, FactSet.) Content provided by WE Sherman and Company. Securities offered through Registered Representatives of Cambridge Investment Research Inc., a broker-dealer, member FINRA/SIPC. Advisory Services offered through Cambridge Investment Research Advisors, a Registered Investment Adviser. Strategic Investment Partners and Cambridge are not affiliated. Indices mentioned are unmanaged and cannot be invested into directly. Past performance is no guarantee of future results. These opinions of Strategic Investment Partners and not necessarily those of Cambridge Investment Research, are for informational purposes only and should not be construed or acted upon as individualized investment advice.