
10-23-2023 Weekly Market Update
The very Big Picture
The long-term valuation of the market is commonly measured by the Cyclically Adjusted Price to Earnings ratio, or “CAPE”, which smooths-out shorter-term earnings swings in order to get a longer-term assessment of market valuation. A CAPE level of 30 is considered to be the upper end of the normal range, and the level at which further PE-ratio expansion comes to a halt (meaning that further increases in market prices only occur as a general response to earnings increases, instead of rising “just because”). The market was recently above that level and has fallen back.
Of course, a “mania” could come along and drive prices higher – much higher, even – and for some years to come. Manias occur when valuation no longer seems to matter, and caution is thrown completely to the wind – as buyers rush in to buy first and ask questions later. Two manias in the last century – the “Roaring Twenties” of the 1920s, and the “Tech Bubble” of the late 1990s – show that the sky is the limit when common sense is overcome by a blind desire to buy. But, of course, the piper must be paid, and the following decade or two were spent in Secular Bear Markets, giving most or all of the mania-gains back.
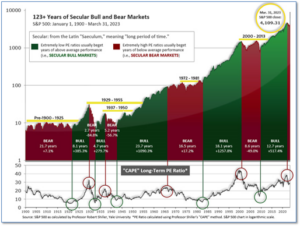
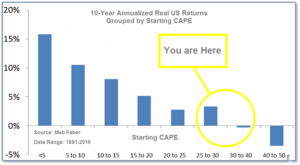
ig. 1 for the 100-year view of Secular Bulls and Bears. The CAPE is now at 28.87, down from the prior week’s 29.58. Since 1881, the average annual return for all ten-year periods that began with a CAPE in this range has been slightly positive to slightly negative (see Fig. 2).
Note: We do not use CAPE as an official input into our methods. However, if history is any guide – and history is typically ‘some’ kind of guide – it’s always good to simply know where we are on the historic continuum, where that may lead, and what sort of expectations one may wish to hold in order to craft an investment strategy that works in any market ‘season’ … whether the current one, or one that may be ‘coming soon’!
The Big Picture:
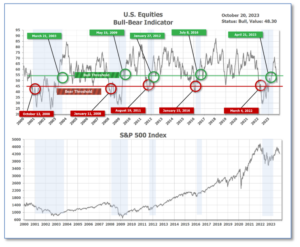
The ‘big picture’ is the (typically) years-long timeframe – the timeframe in which Cyclical Bulls and Bears operate. The U.S. Bull-Bear Indicator finished the week in Bull territory at 48.30 down from the prior week’s 51.23. (see Fig. 3)
In the Quarterly- and Shorter-term Pictures
The Quarterly-Trend Indicator based on the combination of U.S. and International Equities trend-statuses at the start of each quarter – was Positive entering July, indicating positive prospects for equities in the third quarter.
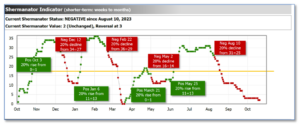
Next, the short-term(weeks to months) Indicator for US Equities turned negative on August 10, and ended the week at 2, down 1 from the prior week.
In the Markets:
U.S. Markets: The major indexes finished the week to the downside as geopolitical concerns, alongside 16-year highs in long-term bond yields, weighed down sentiment and drove the S&P 500 Index to its largest weekly decline in a month. The Dow Jones Industrial Average shed 543 points finishing the week at 33,127, a loss of -1.6%. The technology-heavy NASDAQ Composite Index dropped by -3.2% to 12,984. By market cap, the large cap S&P 500 was down -2.4%, while the mid cap S&P 400 retreated -2.0%. The small cap Russell 2000 ended the week down -2.3%.
International Markets: International indexes finished in a sea of red as well. Canada’s TSX retreated -1.8%, while the United Kingdom’s FTSE 100 dropped -2.6%. On Europe’s mainland, France’s CAC 40 and Germany’s DAX pulled back -2.7% and -2.6% respectively. In Asia, China’s Shanghai Composite fell -3.4%. Japan’s Nikkei retreated -3.3%. As grouped by Morgan Stanley Capital International, developed markets and emerging markets dropped -2.7% and -2.8% this week.
Commodities: Precious metals finished the week in the green as Gold rose 2.7% to $1994.40 per ounce, while Silver rose 2.66% to $23.50 per ounce. Oil finished the week to the upside as well. West Texas Intermediate crude oil closed up 0.44% to $88.08 per barrel. The industrial metal copper, viewed by some analysts as a barometer of world economic health due to its wide variety of uses, ended the week down -0.22%.
U.S. Economic News: Manufacturing activity in New York state ticked down this month as demand remained fragile, but firms were relatively optimistic about future conditions. Data from the Federal Reserve Bank of New York showed that the Empire State Manufacturing Survey’s general business conditions index weakened to minus 4.6 in October from a positive reading of 1.9 last month. The reading fell below the zero threshold, which distinguishes expansion from contraction. The survey showed that new orders flipped to the negative, while shipments experienced little change. Unfilled orders declined at a faster rate than in September. The NY Fed reported that the labor-market indicators pointed towards a slight increase in the overall employment rate. The pace of input-price increases changed modestly from September, while the pace of rising selling prices levelled out. Firms forecast the index declining to 23.1 from 26.3 over the next six months, which remains in positive figures. “New orders and shipments are expected to increase … and employment is expected to grow,” the NY Fed stated.
Home builder confidence dropped to its lowest level since the first quarter in October, as high interest rates continue to take their toll. Sky-high mortgage rates weighed on the optimism of construction firms and customer interest. According to a report from the National Association of Homebuilders (NAHB)/Wells Fargo, the Builder Confidence Index fell from 44 in September to 40 this month. After home loan rates surpassed 7% in August, builder sentiment has slipped for three consecutive months. “Builders have reported lower levels of buyer traffic, as some buyers, particularly younger ones, are priced out of the market because of higher interest rates,” said Alicia Huey, NAHB Chairman. “Higher rates are also increasing the cost and availability of builder development and construction loans, which harms supply and contributes to lower housing affordability.”
Following the sharp 1.5% drop in August, U.S. housing rebounded by 7% last month to an annual pace of 1.36 million units. The construction pace of single-family homes increased by 3.2% and apartment-building construction rose by 17.1%. The only region to report a drop in housing starts was the Northeast. Permits for single-family homes rose by 1.8%, while permits for buildings with at least five units or more dropped by 14%. Through September, approximately 1.68 million homes were under construction. “Looking through the volatility of the month-over-month readings, the pace of homebuilding remains fairly weak, consistent with the high-degree of interest-rate sensitivity of the sector,” said economist at CIBC Capital Markets in Toronto, Ali Jaffery.
Retail sales increased by 0.7% in September, suggesting that households have the buying power to keep the economy expanding. Retail sales represent approximately one-third of consumer spending and are usually helpful in determining the strength of the economy. Strong demand at auto dealers, online stores, alongside higher gasoline prices, contributed to the increase. Setting aside car dealers and gas stations, retail sales still advanced a robust 0.6%, which provides a clearer picture of consumer demand. Sales climbed 0.9% at bars and restaurants. Sales at internet retailers continued their rising streak, growing by 1.1%. “As long as the jobs market remains healthy, consumers should have the cash and confidence to maintain spending,” said Robert Frick, corporate economist at Navy Federal Credit Union.
The Fed’s Beige Book, a collection of anecdotal reports from each of its member banks, sees a slightly weaker U.S. economy. The Federal Reserve survey found that the U.S. economy exhibited slightly weaker growth, helping to ease a tight labor market and cool inflation. The Beige Book showed that only the regions served by the Boston, Chicago, and Minneapolis Fed posted faster economic growth since September. The economy was either unchanged or slightly weaker in the Fed’s nine other regions. The rate of inflation rose at a 3.7% annual pace from September, according to the Consumer Price Index. Despite high oil prices and insurance costs, businesses reported that prospective hires were less aggressive in seeking higher salaries and less inclined to negotiate existing wage offers. Companies cut down on bonuses and passed on a greater share of health-care costs to employees. “Labor market tightness continued to ease across the nation,” the Fed said.
U.S. jobless claims fell to its lowest level since January last week. Initial jobless claims fell to 198,000, according to data from the Labor Department. Continuing claims increased to 1.73 million this month, marking their highest level since July. This could be an indication that those losing their jobs may be having more trouble finding new ones. Applications for unemployment benefits dropped last week as employers across sectors have been adding jobs at a solid pace. “Demand is moderating but remains historically strong, while layoffs are running well below the norms, even for tight labor market episodes in the past,” said Stephen Stanley, chief economist at Santander US Capital Markets. “The labor market remains red hot,” Stanley added.
The Conference Board’s Leading Economic Indicators (LEI) fell by 0.7% in September, marking its 18th negative month in a row. Economists had expected a drop of just 0.4% for the leading index. Historically, an extended losing streak foreshadows a recession. “Although the six-month growth rate in the LEI is somewhat less negative, and the recession signal did not sound, it still signals risk of economic weakness ahead,” said Justyna Zabinska-La Monica, Senior Manager at The Conference Board.
International Economic News: Canadian consumers have tightened their spending, which flattened retail sales through September. According to Statistics Canada, six of nine subsectors were down in sales, including car dealers, furniture, electronics, and appliances retailers. As households faced mortgage payment renewals, Canadians rolled back their purchases for goods. Regionally, sales decreased in six out of the ten provinces in August. British Columbia saw the largest provincial decrease. Sales were down 1.6% in Vancouver. Statistics Canada reported that approximately 12% of Canadian retailers reported that their business activities in August were affected by the strike at the ports in British Columbia.
Inflation in the UK held steady for September after the Bank of England paused its rate hikes. The UK inflation rate remained at 6.7% in September, unchanged from August. Retail sales data for September came in weaker than expected with sales down 1.2% year-on-year. Consumers are spending a lot to receive a lot less for their money as the spread between value and volume has widened. The Consumer Price Index increased 0.5%, in line with economists’ expectations. The Office for National Statistics said the largest upward contribution to the CPI was derived from increased fuel prices. Core CPI came in at 6.1%, down just 0.1% from August. “As we have seen across other G7 countries, inflation rarely falls in a straight line, but if we stick to our plan then we still expect it to keep falling this year,” said U.K. Chancellor of the Exchequer Jeremy Hunt.
Germany’s producer prices fell at its steepest rate in over 50 years, signifying a significant drop in inflation. According to the federal statistical agency, the price of goods produced by German companies fell 14.7% year-on-year in September, marking its fastest annual rate since 1949. Excluding energy, German producer prices rose 0.8% year-on-year. Economists view producer prices as an indicator of future prices paid by shoppers, which are used to calculate consumer price inflation. Exports of goods outside of the EU declined 8.7% in the year to September, with a drastic drop in shipments to both the U.S. and China. Oliver Rakau, an economist at Oxford Economics, said that falling exports were “another reason to expect a fairly hefty quarterly drop in German gross domestic product in the third quarter.”
In Asia, China’s GDP improved for the third quarter as economic activity recovered slightly in September. Gross domestic product grew 4.9% year-on-year, according to data released by the National Bureau of Statistics. On a quarter-by-quarter basis, GDP rose by 1.3%. Between the domestic property crisis, weak confidence in the private sector, and a slowdown in global growth, policymakers struggled to restore economic equilibrium. The statistics bureau said growth in the fourth quarter would have to top 4.4% if China is to achieve its target of 5%. “The improvement in third quarter economic data makes it less likely for the government to launch stimulus in the fourth quarter, as the growth target of 5 per cent is set to be achieved,” said Pinpoint Asset Management chief economist Zhang Zhiwei.
Head of the Japanese Bankers Association, Masahiko Kato, warned that rises in long-term interest rates may hurt the economy. Japanese government bond yields increased to fresh decade highs this week. The 10-year Japanese government bond (JGB) yield rose 2.5 basis points to 0.83%, its highest level since 2013. The recent rise in the 10-year yield has reinforced expectations that the BOJ will raise the cap again at the end of October. Kato said, “there’s a chance economic activity could face downward pressure from rising interest payment for borrowing and a possible yen rebound that hurts exporters’ profits.”
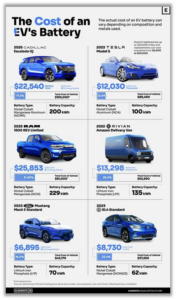
Finally: Some owners of electric vehicles are taken aback when they discover the cost of replacing their batteries. According to the following graphic from Visual Capitalist’s Bruno Venditti and Sabrina Lam, based on the brand and model of the vehicle the cost of a new lithium-ion battery pack could reach $25,000. However, the price of an EV battery pack is also shaped by raw material costs, production expenses, packaging complexities, and supply chain stability. Chemical composition is one of the primary price factors and is essential in establishing the battery’s duration, power, and safety. The standard material used for the anodes in most lithium-ion batteries is graphite. In 2021, NCM batteries dominated 58% of the battery market share. LFP is forecasted to reach 38% of the market share in 2026.
(Sources: All index- and returns-data from Norgate Data and Commodity Systems Incorporated; news from Reuters, Barron’s, Wall St. Journal, Bloomberg.com, ft.com, guggenheimpartners.com, zerohedge.com, ritholtz.com, markit.com, financialpost.com, Eurostat, Statistics Canada, Yahoo! Finance, stocksandnews.com, marketwatch.com, wantchinatimes.com, BBC, 361capital.com, pensionpartners.com, cnbc.com, FactSet.) Content provided by WE Sherman and Company. Securities offered through Registered Representatives of Cambridge Investment Research Inc., a broker-dealer, member FINRA/SIPC. Advisory Services offered through Cambridge Investment Research Advisors, a Registered Investment Adviser. Strategic Investment Partners and Cambridge are not affiliated. Indices mentioned are unmanaged and cannot be invested into directly. Past performance is no guarantee of future results. These opinions of Strategic Investment Partners and not necessarily those of Cambridge Investment Research, are for informational purposes only and should not be construed or acted upon as individualized investment advice.