
10-21-19 Weekly Market Update
The very Big Picture:
The long-term valuation of the market is commonly measured by the Cyclically Adjusted Price to Earnings ratio, or “CAPE”, which smooths out shorter-term earnings swings in order to get a longer-term assessment of market valuation. A CAPE level of 30 is considered to be the upper end of the normal range, and the level at which further PE-ratio expansion comes to a halt (meaning that increases in market prices only occur in a general response to earnings increases, instead of rising “just because”). The market is currently at that level.
Of course, a “mania” could come along and drive prices higher – much higher, even – and for some years to come. Manias occur when valuation no longer seems to matter, and caution is thrown completely to the wind as buyers rush in to buy first and ask questions later. Two manias in the last century – the 1920’s “Roaring Twenties” and the 1990’s “Tech Bubble” – show that the sky is the limit when common sense is overcome by a blind desire to buy. But, of course, the piper must be paid and the following decade or two are spent in Secular Bear Markets, giving most or all of the mania gains back.
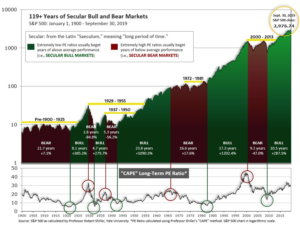
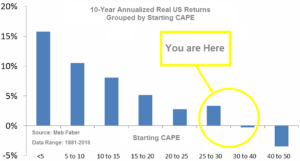
See Fig. 1 for the 100-year view of Secular Bulls and Bears. The CAPE is now at 29.49, up from the prior week’s 29.33, above the level reached at the pre-crash high in October, 2007. Since 1881, the average annual return for all ten year periods that began with a CAPE around this level have been in the 0% – 3%/yr. range. (see Fig. 2).
In the Big Picture:
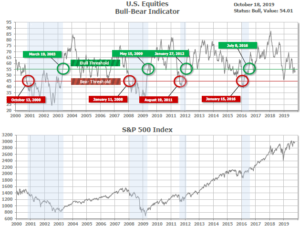
The “big picture” is the months-to-years timeframe – the timeframe in which Cyclical Bulls and Bears operate. The U.S. Bull-Bear Indicator (see Fig. 3) is in Cyclical Bull territory at 54.01, up from the prior week’s 52.66.
In the Intermediate and Shorter-term Picture:
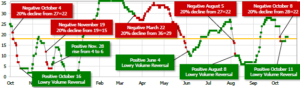
The Shorter-term (weeks to months) Indicator (see Fig. 4) is positive. The indicator ended the week at 19, up from the prior week’s 17. Separately, the Intermediate-term Quarterly Trend Indicator – based on domestic and international stock trend status at the start of each quarter – was positive entering October, indicating positive prospects for equities in the fourth quarter of 2019.
Timeframe summary:
In the Secular (years to decades) timeframe (Figs. 1 & 2), the long-term valuation of the market is historically too high to sustain rip-roaring multi-year returns. The Bull-Bear Indicator (months to years) remains positive (Fig. 3), indicating a potential uptrend in the longer timeframe. In the intermediate timeframe, the Quarterly Trend Indicator (months to quarters) is positive for Q4, and the shorter (weeks to months) timeframe (Fig. 4) is positive. Therefore, with three indicators positive and none negative, the U.S. equity markets are rated as Positive.
In the markets:
U.S. Markets: All but one of the major indexes recorded modest gains this week as earnings season kicked in. The gains brought the large-cap S&P 500 within less than 1% of its record high before falling back on Friday. The small cap Russell 2000 outperformed, but remained in correction territory—down over 10% from its August 2018 peak. The Dow Jones Industrial Average was the only index to finish the week lower, closing at 26,770, a decline of ‑0.2%. The technology-heavy NASDAQ Composite rose 0.4%, while the large cap S&P 500 added 0.5%. The S&P 400 midcap index and small cap Russell 2000 were the winners this week, rising 1.1% and 1.6%, respectively.
International Markets: Canada’s TSX fell for a fourth consecutive week, giving up -0.2%. Across the Atlantic, the United Kingdom’s FTSE retraced last week’s gain by declining -1.3%. On Europe’s mainland, France’s CAC 40 fell ‑0.5% while Germany’s DAX rose 1%. In Asia, China’s Shanghai Composite declined -1.2%, while Japan’s Nikkei surged 3.2%. As grouped by Morgan Stanley Capital International, developed markets rose 1.1% while emerging markets added 0.6%.
Commodities: Precious metals rebounded slightly last week. Gold rose 0.4%, finishing the week at $1494.10 an ounce, while Silver managed a 0.2% gain, to $17.58 an ounce. Crude oil retraced some of last week’s gain by retreating -1.5% to $53.87 per barrel of West Texas Intermediate crude. The industrial metal copper, viewed by analysts as a barometer of global economic health due to its wide variety of industrial uses, finished the week up 0.3%.
U.S. Economic News: The number of Americans seeking first-time unemployment benefits rose slightly last week, but remained near a half-century low. The Labor Department reported initial jobless claims, a rough way to measure layoffs, increased by 4,000 to 214,000 last week. Economists had forecast a reading of 215,000. Most of the increase in new jobless claims was concentrated in the state of California. No other state reported significant changes. The less-volatile monthly average of new claims rose by 1,000 to 214,750. Continuing claims, which counts the number of people already collecting unemployment benefits, declined by 10,000 to 1.68 million. Those claims have remained below 2 million since early 2017. Thomas Simons, senior money market economist at Jefferies LLC wrote, “Claims remain near historically low levels and reflect a very solid labor market.”
The number of houses under construction in September declined by 9%, the Commerce Department reported, but a recent surge in permits suggests the decline is most likely just a brief pause. Housing starts slid to an annual rate of 1.26 million last month, revised down from 1.39 million in August. The slowdown was predominantly concentrated in new buildings with five units or more, such as apartment complexes. New construction on single-family homes actually rose slightly to an annual rate of 918,000, marking the highest level since the start of 2019. Economists had expected starts to decline to 1.32 million. Meanwhile, permits to build new houses fell about 3% to a 1.39 million annualized pace—but that number is 8% higher compared to the same time last year.
A survey of the nation’s homebuilders surged to an almost two-year high this month, thanks to dramatically lower mortgage rates. The National Association of Home Builders (NAHB) reported its survey of home-builder sentiment rose to 71 in October, up from 68 in the prior month. Readings over 50 indicate that confidence is improving. At the beginning of the year the index stood at a 3 ½ year low of 56. Builders are even more optimistic about the future. The NAHB sub index that tracks builder expectations for the next 6 months rose to a 19-month high, very close to a post-recession peak.
Sales at U.S. retailers fell last month, ending a streak of six consecutive months of solid gains that helped fuel economic growth through the middle of the year. The Commerce Department reported retail sales fell 0.3% last month, missing the consensus forecast for a 0.3% increase. In the details, sales fell almost 1% at auto dealers, despite the fact they reported a strong increase in the number of new vehicles sold. Sales also declined 0.7% at gas stations, reflecting lower prices at the pump. Auto and gas sales represent an outsized portion of overall retail sales. The softness was widespread, however. Sales also fell at home centers, department stores and internet retailers. The drop in Internet sales was the first this year. The only segments of the retail industry that recorded strong sales were health stores and pharmacies.
The Conference Board reported its index that measures the nation’s economic health slipped last month and is likely to remain soft in the months ahead. The Leading Economic Index (LEI), a weighted gauge of 10 indicators designed to signal peaks and valleys in the business cycle, slipped 0.1% in September—its second decline in a row. The index fell mostly because of weakness among American manufacturers, whose sales have suffered from sluggish exports and disruptions in their supply chains caused by the U.S. trade war with China. The narrowing spread between short-term and long-term U.S. interest rates — often a precursor to recession — was another negative. Ataman Ozyildirim, director of business cycles research at the board, stated “The LEI reflects uncertainty in the outlook and falling business expectations, brought on by the downturn in the industrial sector and trade disputes. Looking ahead, the LEI is consistent with an economy that is still growing, albeit more slowly, through the end of the year and into 2020.”
The Federal Reserve’s Beige Book, a collection of anecdotes collected by each of the Federal Reserve member banks from business contacts within their respective regions, reported the U.S. economy may seem to be slowing a bit, and has only expanded at “a slight to modest pace” since early September. Business activity varied across the country, with the Midwest and Great Plains reports more downbeat than those from the Southern and Western regions. The U.S. – China trade dispute continued to affect business activity. Manufacturers were starting to lay-off workers in a number of districts because orders were weak, but other firms said they wanted to retain scarce workers and so are cutting hours but not jobs. In general, slower but continued economic growth was the forecast. “Business contacts mostly expect the economic expansion to continue; however, many lowered their outlooks for growth in the coming 6 to 12 months,” the report said.
International Economic News: Canada’s economy has been a bright spot as the global economy dims, but not for much longer according to several economists at Bloomberg’s Canadian Fixed Income Conference this week. Most bearish was David Rosenberg, chief economist at Gluskin Sheff & Associates, who put odds of a recession in Canada at 80%. Rosenberg sees slowing global growth swamping any fiscal stimulus the Bank of Canada may attempt. Rosenberg stated, “The way I look at the Canadian economy right now, it’s really quite bifurcated. I call it the Triple C economy: there’s crude, condos and cannabis.” Rod Balkwill, executive director of Saskatchewan’s Treasury Management Branch, said he sees a 60% to 70% risk of a recession, noting the housing market’s strength is “pretty narrowly based.” Charles Allain, an executive director in Nova Scotia’s finance department, said he’s raised the odds substantially. This time last year, I would’ve said a very small potential of 10% to 15%,” said Allain. “But I’ve got to think it’s closer to 50% now.”
The United Kingdom’s Parliament voted to withhold approval of Prime Minister Boris Johnson’s Brexit deal, but Johnson stated he planned to press ahead and seek approval of his deal in the coming week. Britain remains deeply divided over Brexit. On Saturday, organizers estimated that protests pushing for a second referendum drew 1 million people into the streets of London in on-and-off rain. The vote was close: 322 in favor and 306 against. Johnson responded to the vote with emphatic finger-jabbing insisting, “I’m not daunted or dismayed by this particular result.” According to legislation passed last month, if a deal was not approved by 11 p.m. Oct. 19, Johnson was required to formally seek a three-month extension beyond the Oct. 31 deadline.
French Finance Minister Bruno Lemaire stated U.S. tariffs on the European Union would have “very negative consequences”. “If President Donald Trump follows through on a plan to impose tariffs on European goods in the dispute over Airbus, it will have concrete repercussions,” Lemaire said. Lemaire’s comments came shortly after his meeting with U.S. Treasury Secretary Steven Mnuchin. Lemaire warned the US against starting another front in its trade conflicts, with Washington already involved in a costly tariff battle with China. The European Union has vowed to retaliate with tariffs of its own in a parallel WTO case against Boeing. “I think this will not be in the interest of the US, it would not be in the interest of the EU, and it would have, of course, negative consequences on the level of the world growth,” Le Maire warned.
The German government has revised down its forecast for economic growth next year from 1.5% to just 1%–a further sign of the slowdown clouding the prospects for the Eurozone’s largest economy. Germany’s industrial economy has been hit by rising global trade tensions, Brexit-related uncertainty, and turmoil in Germany’s auto industry. The economy shrank by 0.1% in the second quarter and is widely expected to decline further in the third, tipping it into official recession. However, economics minister Peter Altmaier noted that other parts of the economy were booming, such as craft trades and the construction industry, thanks to strong domestic demand.
China’s economic growth slowed to its lowest level since 1992 as the world’s second largest economy continues its trade war with the United States. According to government statistics, China’s gross domestic product grew by an annualized 6% in the three months to September 30. The reading was down from 6.2% the previous quarter and missed the average forecast of 6.1%. “Trade tension with the US is the key factor weighing on business sentiment and investment activities, although domestic stimulus policies are providing some buffer from the down side,” said Chaoping Zhu, global market strategist for JP Morgan Asset Management. The worse than expected figures emerged just one week after the United States and China reached a tentative trade truce to avoid more damage to the world’s two largest economies.
Japan’s Finance Minister Taro Aso says he is ready to give the world’s third-largest economy a boost as it also struggles with the effects of the trade war between China and the United States. Aso made the comments to reporters after attending a Group of 20 finance leaders’ dinner. “Given uncertainty over the global economy, exports are falling and weighing on manufacturers’ output. But the weakness has yet to spread to non-manufacturers or domestic demand,” Aso said. “If we need to compile some form of an economic stimulus package, we are ready to take various types of fiscal measures.”
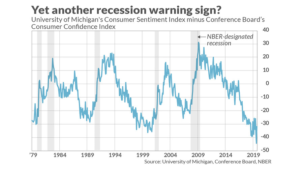
Finally: A little-known recession indicator is now flashing a warning sign, and its record over the last 40 years suggests we should pay attention to it. The indicator focuses on divergences between the University of Michigan’s Consumer Sentiment Index and the Conference Board’s Consumer Confidence Index. Both indexes are widely reported with many investors wrongly considering them to be interchangeable. The indexes are similar, but different. U of M’s index focuses more on how respondents feel about their own personal financial situation, whereas the Conference Board’s focuses on how they feel about the overall economy. James Stack, editor of the InvesTech Research newsletter, says that periods when the two measures diverge are significant – and they are very divergent now. The composite indicator typically reaches a low prior to recessions, and it currently is lower than at any other time since 1979.
(Sources: all index return data from Yahoo Finance; Reuters, Barron’s, Wall St Journal, Bloomberg.com, ft.com, guggenheimpartners.com, zerohedge.com, ritholtz.com, markit.com, financialpost.com, Eurostat, Statistics Canada, Yahoo! Finance, stocksandnews.com, marketwatch.com, wantchinatimes.com, BBC, 361capital.com, pensionpartners.com, cnbc.com, FactSet) Securities offered through Registered Representatives of Cambridge Investment Research Inc., a broker-dealer, member FINRA/SIPC. Advisory Services offered through Cambridge Investment Research Advisors, a Registered Investment Adviser. Strategic Investment Partners and Cambridge are not affiliated.
Indices mentioned are unmanaged and cannot be invested into directly. Past performance is no guarantee of future results. All Investing involves risk. Depending on the types of investments, there may be varying degrees of risk. Investors should be prepared to bear loss, including total loss of principal.