
10-2-2023 Weekly Market Update
The very Big Picture
The long-term valuation of the market is commonly measured by the Cyclically Adjusted Price to Earnings ratio, or “CAPE”, which smooths-out shorter-term earnings swings in order to get a longer-term assessment of market valuation. A CAPE level of 30 is considered to be the upper end of the normal range, and the level at which further PE-ratio expansion comes to a halt (meaning that further increases in market prices only occur as a general response to earnings increases, instead of rising “just because”). The market was recently above that level and has fallen back.
Of course, a “mania” could come along and drive prices higher – much higher, even – and for some years to come. Manias occur when valuation no longer seems to matter, and caution is thrown completely to the wind – as buyers rush in to buy first, and ask questions later. Two manias in the last century – the “Roaring Twenties” of the 1920s, and the “Tech Bubble” of the late 1990s – show that the sky is the limit when common sense is overcome by a blind desire to buy. But, of course, the piper must be paid, and the following decade or two were spent in Secular Bear Markets, giving most or all of the mania-gains back.
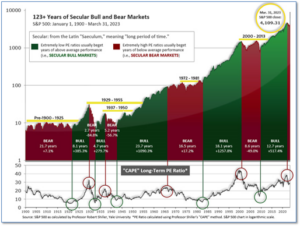
See Fig. 1 for the 100-year view of Secular Bulls and Bears. The CAPE is now at 29.48, down from the prior week’s 29.70. Since 1881, the average annual return for all ten-year periods that began with a CAPE in this range has been slightly positive to slightly negative (see Fig. 2).
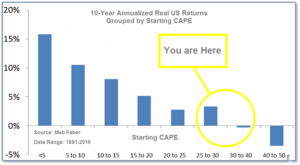
Note: We do not use CAPE as an official input into our methods. However, if history is any guide – and history is typically ‘some’ kind of guide – it’s always good to simply know where we are on the historic continuum, where that may lead, and what sort of expectations one may wish to hold in order to craft an investment strategy that works in any market ‘season’ … whether the current one, or one that may be ‘coming soon’!
The Big Picture:
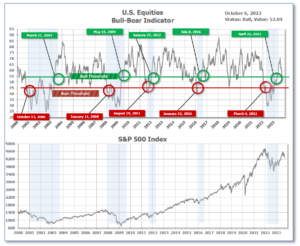
The ‘big picture’ is the (typically) years-long timeframe – the timeframe in which Cyclical Bulls and Bears operate. The U.S. Bull-Bear Indicator finished the week in Bull territory at 54.27 down from the prior week’s 57.43. (see Fig. 3)
In the Quarterly- and Shorter-term Pictures
The Quarterly-Trend Indicator based on the combination of U.S. and International Equities trend-statuses at the start of each quarter – was Positive entering July, indicating positive prospects for equities in the third quarter.
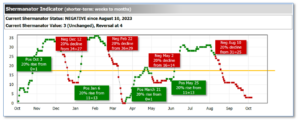
Next, the short-term(weeks to months) Indicator for US Equities turned negative on August 10, and ended the week at 3, down 4 from the prior week.
In the Markets:
U.S. Markets: Higher oil prices contributed to concerns that inflation could prove more difficult for central banks to tame, spurring a sell-off in bonds. As the week wore on, the increasing likelihood of a U.S. government shutdown may also have weighed on investor sentiment. The major benchmarks finished the week mixed. The Dow Jones Industrial Average shed 456 points finishing the week at 33,508. The technology-heavy NASDAQ Composite ticked up 0.1% to 13,219. By market cap, the large cap S&P 500 retreated -0.7%, while the mid cap S&P 400 rose 0.3%. The small cap Russell 2000 finished the week up 0.5%.
International Markets: International markets finished the week predominantly to the downside. Canada’s TSX declined -1.2% along with the UK’s FTSE 100 which fell -1%. France and Germany pulled back -0.7% and -1.1% respectively. In Asia, China’s Shanghai Composite ended down -0.7%. Japan’s Nikkei declined -1.7%. As grouped by Morgan Stanley Capital International, developed markets and emerging markets each ended the week down -1.4%.
Commodities: Precious metals finished the week to the downside. Gold pulled back -4.1% to $1866.10 per ounce, while Silver retreated -5.9% to $22.45. The industrial metal copper, viewed by some analysts as a barometer of world economic health due to its wide variety of uses, finished up 1.1%. West Texas Intermediate crude oil finished the week up 0.8% to $90.79 per barrel.
U.S. Economic News: The number of Americans filing first-time claims for unemployment benefits ticked up slightly but remained near historically low levels. The Labor Department reported initial jobless claims edged up by 2000 from the prior week to 204,000. Economists had expected new claims to total 214,000. New jobless claims fell in 33 of the 53 states and territories that report these figures to the federal government. Claims rose in 20 states. Meanwhile, the number of people already collecting benefits rose by 12,000 to 1.67 million. That number also remains near historic lows. Corporate economist Robert Frick of Navy Federal Credit Union stated, “Low claims remain a bedrock reason why the expansion should continue. Employers still cling to employees because business in most industries is good and hiring is hard.”
Home prices continued to rise in July, hitting a new record high and marking a sixth consecutive month of gains. S&P CoreLogic reported its Case-Shiller National Home Price Index rose 0.6% from the month before. Compared to the same time last year, prices were up 1%. “The increase in prices that began in January has now erased the earlier decline, so that July represents a new all-time high for the National Composite [index],” said Craig Lazzara, managing director at S&P Dow Jones Indices, in a statement. What’s more, he added, the recovery in home prices is broadly based. As was the case last month, 10 of the 20 cities in the sample have reached all-time high levels.
Sales of newly constructed homes plunged 8.7% in August to a seasonally-adjusted annual rate of 675,000, according to a joint report from the Census Bureau and U.S. Department of Housing and Urban Development. The reading came as mortgage rates topped 7% to their highest levels in more than 20 years. Homeowners with mortgage rates of 3% or 4% are reluctant to sell and buy another home at a much higher rate. New construction has been attracting determined buyers frustrated by the historically low supply of existing homes. But, affordability concerns remain. The median price of a new construction home was $430,300 in August. Kelly Mangold of RCLCO Real Estate Consulting wrote in a note, “Affordability remains a challenge as the tight housing market keeps prices elevated, and conditions are not likely to improve until interest rates or pricing comes down.”
The confidence of American consumers slipped this month, particularly about the future, as expectations persist that interest rates will remain elevated for an extended period. The Conference Board, a business research group, said Tuesday that its consumer confidence index fell to 103 in September from 108.7 in August. Analysts were expecting a smaller decrease, to a reading of 105. The index measures both Americans’ assessment of current economic conditions and their outlook for the next six months. Most concerning was the decline in the index measuring future expectations, which tumbled to 73.7 in September from 83.3 in August. Readings below 80 for future expectations historically signal a recession within a year.
Orders for long-lasting goods expected to last at least 3 years, so-called ‘durable goods’, rose stronger than expected in August, but the increase stemmed primarily from higher defense spending for military hardware sent to Ukraine. The government reported durable goods orders rose 0.2%. Economists had expected orders to decline -0.5%. However, subtracting defense spending, orders were actually down -0.7% last month. Overall business investment remains weak and conditions aren’t expected to improve much any time soon. Companies have curtailed investment since last year in response to rising interest rates and higher odds of recession. Olivia Cross of Capital Economics doesn’t anticipate improvement anytime soon writing, “Headwinds to the sector are likely to grow over the rest of the year as tighter credit conditions weigh more heavily on investment and economic growth weakens.”
The consumer sentiment index rose slightly this month, but rising interest rates bolster economic uncertainty. Consumer sentiment improved slightly through September, rising from 67.7 to 68.1. However, Americans remain uncertain about the economy’s future. Household budgets are weighed upon by higher gas prices and rising interest rates. Compared to earlier this month, a gauge that measures what consumers think about the current state of the economy increased from 69.8 to 71.4. Whereas the measurement of their expectations for the subsequent six months slipped from 66.3 to 66.0. Americans expect inflation to average 3.2% in 2024, down from 3.5% last month. According to the consumer-price index, the official rate of inflation is 3.7%. Rising interest rates are attributing greater pressure upon the economy. “Consumers are understandably unsure about the trajectory of the economy given multiple sources of uncertainty, for example over the possible shutdown of the federal government and labor disputes in the auto industry,” said Joanne Hsu, director of the consumer sentiment survey.
The cost of goods and services rose a sharp 0.4% in August — the biggest increase in seven months — mostly because of higher gas prices. But inflation more broadly continued to slow. The increase in the so-called PCE price index over the past year climbed to 3.5% from 3.4%, the government said. The price gauge is the Federal Reserve’s preferred measure of inflation. The core PCE rate of inflation, however, rose a soft 0.1% last month. Economists had forecast a 0.2% increase. The core rate omits volatile food and energy costs and is viewed by the Fed as a better predictor of future inflation trends. The rate of core inflation over the past year decelerated to 3.9% from 4.3%, putting it at a nearly two-year low.
International Economic News: The Canadian economy is forecasted to get ‘back on its feet’ in 2024, but the economy is in ‘a rough patch.’ Canada’s economic struggles are expected to ease when growth returns, and the Bank of Canada cuts its key lending rate next year. “The recovery will pick up steam in the second half of 2024 because it’s during the time we anticipate the Bank of Canada will be able to pivot from having the high interest rates we’re living with today,” said Dawn Desjardins, chief economist at Deloitte Canada. She expects the next two quarters will be hard on the Canadian economy. Household debt and interest payments are expected to rise due to the Bank of Canada’s months-long crackdown on high inflation. Consumer spending is forecasted to grow by 2% this year but dwindle to 1.2% in 2024. With the central bank’s rate increases stressing their budgets, confidence among Canadian consumers remains weak. “Canada’s economy has entered a rough patch and the growth is likely to be negligible,” Desjardins said. “In fact, we have a few negative quarters in the forecast,” she added.
Britain will ease key banking and insurance rules to boost its financial sector. Britain’s finance industry accounts for approximately 12% of UK economic output. The Bank of England released a reform of Solvency II insurance capital rules this week. The insurance industry, and lawmakers who favored Britain’s exit from the bloc, view the reform as a “Brexit dividend” unlocking up to 100 billion pounds, or $122.01 billion, for investment. A matching adjustment will provide capital relief, worth approximately 66 billion pounds, on assets generating returns to cover future payouts to policyholders. The Association of British Insurers said its members were committed to using the reforms to move 100 billion pounds into good projects, while protecting policyholders. The BoE Deputy Governor encouraged the government to monitor that insurers use the capital from the reforms to invest in the economy. “These proposals aim to promote policyholder protection while enabling the annuity sector to meet its commitments to the government to increase investment in the UK economy,” Sam Woods, Bank of England Deputy Governor, said.
French President Emmanuel Macron’s budget for 2024 will test taxpayer patience as support for inflation-hit households is withdrawn and public money is poured into the climate transition. France’s Finance Minister Bruno Le Maire said handling the impact of inflation on households remains the government’s forefront priority. In a costly move for public finances, the government will forfeit around €6 billion of potential revenue in pegging the thresholds for income tax to inflation. Indexing to price increases will drive up spending on pensions by €14 billion and welfare benefits by €4.5 billion. “Macron is trying to avoid measures that could generate a movement similar to the Yellow Vests,” said Antonio Barroso, deputy director of research at political advisory Teneo. The French government budget includes a €7 billion, or $7.4 billion, to €40 billion increase in investments in green programs, said Le Maire. To shift the burden of paying for the green transition to businesses from households, Le Maire said the government would introduce an additional tax on airports and toll roads. Paris airports operator ADP SA estimated an impact of approximately €90 million on its core earnings next year. “Investment needed for the ecological transition is extremely high and absolutely essential,” Le Maire said.
Germany’s GDP is expected to contract by 0.6% this year, according to five German economic institutes. The four German institutes, alongside the Austrian Institute of Economic Research, are forecasting GDP growth of 1.3% for 2024. This year, GDP is expected to shrink for Q3, following stagnation in Q2. As for inflation, the institutes forecast the rate to be at 6.1% this year but drop to 2.6% in 2024. Last year’s inflation rate was at 6.9%. Germany’s economic activity is weighed down by rising interest rates, while consumption is depressed by high inflation. “Industry and private consumption are recovering more slowly than we had expected in spring,” said Oliver Holtemöller, vice president of the Halle Institute for Economic Research.
The ongoing property crisis has put China’s economic growth target of 5% for 2023 at risk. The economy is projected to expand by 5% this year with analysts citing property as the most prominent challenge for the nation. “The drag from the property slump, fragile sentiment and widespread debt stress in the corporate sector could well knock the economy onto a lower trajectory,” economists Chang Shu and Andrej Sokol said. According to home sales data, a housing rally in the nation’s largest cities has already lost momentum. “Targeted support has yet to filter through more convincingly into the property market data,” said Arjen van Dijkhuizen, senior economist at ABN Amro. Li Daokui, former central bank adviser, said the property market could take up to a year to recover. While sales in large cities could return to growth sooner, it could take as long as a year to record “good recovery” in smaller cities, Li said. “The real estate sector will continue to be under mounting pressure,” analysts at Poseidon Partner, a Hong Kong based investment firm, said. “We expect to see players who racked up debt in the past to continue to suffer,” they added.
To ease inflation pain, Japan compiled an economic stimulus package to assist households. Japan’s Prime Minister Fumio Kishida instructed his cabinet to compile the package and assign an extra budget to fund it, although the size and substance of the extra budget remains unclear. The purpose of the package will be to protect people from cost-push inflation, reinforce sustainable wage and income growth, boost domestic investment to spur growth, and encourage infrastructure investment. The new economic measures were intended to move Japan’s economy, which historically focused on cost cutting, onto a new path. Kishida warned investors trying to sell off the yen, which will boost import bills for food and energy, saying he was closely watching currency movements with a high sense of urgency. “It’s important for currencies to move stably,” Kishida said. “Excessive volatility is undesirable,” he added.
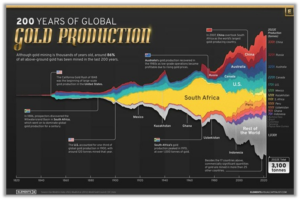
Finally: The best-known gold rush in modern history occurred in California in 1848, when James Marshall discovered gold in the Sacramento Valley. As word spread, thousands of migrants flocked to California in search of gold. While gold mining has been around for thousands of years, it’s estimated that roughly 86% of all the above-ground gold has been extracted in the last 200 years. With modern mining techniques making large-scale production possible, global gold production has grown exponentially since the 1800s. Using data from ‘Our World in Data’ analysts Govind Bhutada and Miranda Smith created the following infographic to visualize global gold production by country from 1820 to 2022, showing how gold mining has evolved over time. In 2022, around 31% of the world’s gold production came from three countries—China, Russia, and Australia, with each producing over 300 tons of the precious metal.
(Sources: All index- and returns-data from Norgate Data and Commodity Systems Incorporated; news from Reuters, Barron’s, Wall St. Journal, Bloomberg.com, ft.com, guggenheimpartners.com, zerohedge.com, ritholtz.com, markit.com, financialpost.com, Eurostat, Statistics Canada, Yahoo! Finance, stocksandnews.com, marketwatch.com, wantchinatimes.com, BBC, 361capital.com, pensionpartners.com, cnbc.com, FactSet.) Content provided by WE Sherman and Company. Securities offered through Registered Representatives of Cambridge Investment Research Inc., a broker-dealer, member FINRA/SIPC. Advisory Services offered through Cambridge Investment Research Advisors, a Registered Investment Adviser. Strategic Investment Partners and Cambridge are not affiliated. Indices mentioned are unmanaged and cannot be invested into directly. Past performance is no guarantee of future results. These opinions of Strategic Investment Partners and not necessarily those of Cambridge Investment Research, are for informational purposes only and should not be construed or acted upon as individualized investment advice.
