
10-25-2021 Weekly Market Update
The very Big Picture
The long-term valuation of the market is commonly measured by the Cyclically Adjusted Price to Earnings ratio, or “CAPE”, which smooths-out shorter-term earnings swings in order to get a longer-term assessment of market valuation. A CAPE level of 30 is considered to be the upper end of the normal range, and the level at which further PE-ratio expansion comes to a halt (meaning that further increases in market prices only occur as a general response to earnings increases, instead of rising “just because”). The market is now above at that level.
Of course, a “mania” could come along and drive prices higher – much higher, even – and for some years to come. Manias occur when valuation no longer seems to matter, and caution is thrown completely to the wind – as buyers rush in to buy first, and ask questions later. Two manias in the last century – the “Roaring Twenties” of the 1920s, and the “Tech Bubble” of the late 1990s – show that the sky is the limit when common sense is overcome by a blind desire to buy. But, of course, the piper must be paid, and the following decade or two were spent in Secular Bear Markets, giving most or all of the mania-gains back.
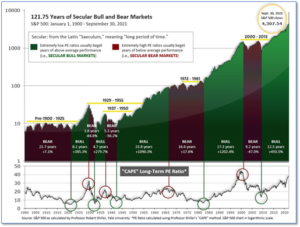
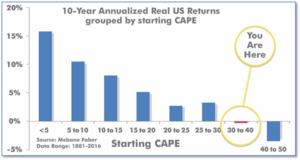
See Fig. 1 for the 100-year view of Secular Bulls and Bears. The CAPE is now at 38.70, up from the prior week’s 38.08. Since 1881, the average annual return for all ten-year periods that began with a CAPE in the 30-40 range has been slightly negative (see Fig. 2).
Note: We do not use CAPE as an official input into our methods. However, if history is any guide – and history is typically ‘some’ kind of guide – it’s always good to simply know where we are on the historic continuum, where that may lead, and what sort of expectations one may wish to hold in order to craft an investment strategy that works in any market ‘season’ … whether current one, or one that may be ‘coming soon’!
The Big Picture:
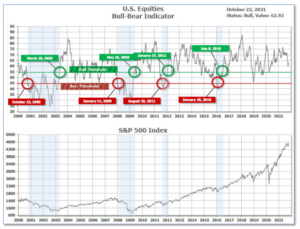
The ‘big picture’ is the (typically) years-long timeframe – the timeframe in which Cyclical Bulls and Bears operate. The U.S. Bull-Bear Indicator is in Cyclical Bull territory at 62.92, up from the prior week’s 61.17.
In the Quarterly- and Shorter-term Pictures
The Quarterly-Trend Indicator based on the combination of U.S. and International Equities trend-statuses at the start of each quarter – was Positive entering October, indicating positive prospects for equities in the fourth quarter of 2021.
Next, the short-term(weeks to months) Indicator for US Equities turned positive on September 27 and ended the week at 16, up from the prior week’s 10.
In the Markets:
U.S. Markets: Most of the major U.S. benchmark indexes moved to record highs this week, propelled by a series of positive earnings surprises. The Dow Jones Industrial Average rose 382 points last week closing at 35,677—a gain of 1.1%. The technology-heavy NASDAQ Composite crossed the 15,000 level with a 193-point gain, up 1.3%. By market cap, the large cap S&P 500 gained 1.6%, while the mid cap S&P 400 and small cap Russell 2000 rose 1.8% and 1.1%, respectively.
International Markets: International markets were mixed for the week. Canada’s TSX gained 1.4%, while the United Kingdom’s FTSE 100 shed -0.4%. France’s CAC 40 ticked up 0.1%, while Germany’s DAX declined -0.3%. In Asia, China’s Shanghai Composite managed a 0.3% gain. Japan’s Nikkei gave up some of last week’s strong up move by retracing -0.9%. As grouped by Morgan Stanley Capital International, developed markets rose 0.7% and emerging markets gained 0.2%.
Commodities: Precious metals finished the week solidly to the upside. Gold rose 1.6% to $1796.30 per ounce, while Silver surged 4.7% to $24.45. Energy continued its strong uptrend finishing up for a ninth consecutive week. West Texas Intermediate crude oil rose 2.5% to $83.76 per barrel. The industrial metal copper, viewed by some analysts as a barometer of world economic health due to its wide variety of uses, retraced much of last week’s surge finishing the week down -4.9%.
U.S. Economic News: The number of Americans filing for first-time unemployment benefits fell again last week to a new pandemic low, as companies retained the workers they already have amid the biggest labor shortage in decades. The Labor Department reported new jobless claims dropped by 6,000 to just 290,000. Economists had expected new claims to total 300,000. New jobless claims fell the most last week in Virginia, Pennsylvania and Michigan. The only state to post a big increase was California. Meanwhile, the number of people already collecting benefits, known as “continuing claims”, declined by 122,000 to 2.48 million. That number is also at a pandemic low.
Sales of existing homes rose in September as the threat of rising mortgage rates compelled some buyers to lock in deals before the window of opportunity closed. The National Association of Realtors (NAR) reported existing home sales increased 7% to a seasonally-adjusted annual rate of 6.29 million. Economists had expected only 6.1 million homes to change hands. Lawrence Yun, chief economist for the NAR stated rising inventory in previous months allowed for September’s increase. Total housing inventory fell 0.8% between August and September, and was down 13% compared to a year ago. As of the end of the month, there was just a 2.4 months’ supply of existing homes available. Analysts consider a 6-month supply a “balanced” housing market. The median price for an existing home was $352,800, up more than 13% from a year ago. On a regional basis, every part of the country saw an increase in sales, led by an 8.6% jump in the South.
Sentiment among home builders improved for the second consecutive month, rebounding further from the low point reached at the end of summer. The National Association of Home Builders’ (NAHB) reported its monthly confidence index increased four points to a reading of 80 in October. The figure represents the highest confidence since July. Shortages of both skilled labor and key building supplies continued to weigh on the industry. The NAHB chairman Chuck Fowke, a custom home builder from Tampa, FL., wrote in the report, “Although demand and home sales remain strong, builders continue to grapple with ongoing supply chain disruptions and labor shortages that are delaying completion times and putting upward pressure on building material and home prices.” All regions saw a monthly increase in builder confidence. However, over the past three months, builder sentiment was flat across the Northeast, the South and the West, only rising slightly in the Midwest.
Despite the improved sentiment from builders noted above the U.S. Census Bureau reported its measure of home construction fell in September. Builders started construction on an annualized rate of 1.56 million homes last month, a 1.6% decline from August. Economists had expected housing starts to occur at a pace of 1.61 million. In addition, permits, which give analysts an indication of future building activity, also dropped in September. Permitting for new homes occurred at a seasonally-adjusted annual rate of 1.59 million, down 7.7% from August. This was in line with the rate of permitting from a year ago but missed expectations of 1.67 million.
Analytics firm IHS Markit reported the dominant services side of the U.S. economy sped up in October after a slowdown the month earlier, and manufacturers also expanded activity in its latest report. A survey of senior executives in service-oriented companies rebounded to a three-month high of 58.2 from 54.9 Markit said, while its survey of manufacturers dipped slightly to 59.2, but remained at high levels. Readings over 50 signal growth, while those over 55 are considered exceptional. Businesses across the board report plenty of demand, but as in other reports, can’t find enough workers or supplies to satisfy it. The result was a record rise in the backlog of unfilled orders and prices paid for parts and materials. The shortages have sparked the biggest increase in consumer prices in 30 years, a situation that also won’t reverse very quickly. “While the economy looks set for stronger growth in the fourth quarter, the upward rise in inflationary pressures also shows no signs of abating,” said Chris Williamson, chief business economist at IHS Markit.
The U.S. economy is still growing at a solid pace, according to the latest “Beige Book” report from the Federal Reserve. The report, a collection of anecdotal submissions from each of its member banks, noted the near-universal reports of a lack of workers and the inability of companies to obtain needed parts and supplies. The latest Beige Book cited labor shortages 26 times compared to just six mentions in January; supply-chain problems 37 times vs. just nine mentions in January and none before the pandemic started in March 2020. The latest Beige Book covers the period from September through early October.
International Economic News: The Canadian government argued in a letter to U.S. congressional leadership that electric vehicle tax credits would cause ‘serious harm’ to their auto industry. Canadian Trade Minister Mary Ng told lawmakers and officials in the Biden administration that the two nations’ auto supply chains are deeply integrated, and the proposed credits “would cause serious and irreparable harm” to both the Canadian and U.S. auto industry. “If passed into law, these credits would have a major adverse impact on the future of EV and automotive production in Canada, resulting in the risk of severe economic harm and tens of thousands of job losses in one of Canada’s largest manufacturing sectors,” Ng wrote. The EV tax credit proposal is part of Democrats’ social safety net and climate legislation currently being debated in Washington.
Across the Atlantic, the Bank of England’s top economist stated inflation could surge above 5% early next year in the United Kingdom as product and labor shortages continue to hamper the country’s recovery. “I would not be shocked — let’s put it that way — if we see an inflation print close to or above 5% [in the months ahead,” Huw Pill said. “And that’s a very uncomfortable place for a central bank with an inflation target of 2% to be.” Inflation has been running near 3% in the United Kingdom as the country’s economy bounces back from a steep contraction in 2020 caused by the coronavirus pandemic.
On Europe’s mainland, France has announced a €100 handout for people on low to middle incomes and promised to freeze fuel prices in an attempt to quell growing anger over record fuel prices and increased living costs. Government spokesperson Gabriel Attal stated, “We obviously want to protect French people, above all those who work hard and are taking the full force of these price rises.” The prime minister, Jean Castex, said the one-off “inflation payout” would be given to all those earning less than €2,000 net a month, including private and public sector workers, the self-employed, job seekers and retired people. Castex said it would affect about 38 million people, and petrol prices would also be “frozen for the whole of 2022.”
German businesses have warned that a “veritable economic crisis” looms due to rising fuel prices. The SME Association, which represents small and medium-sized companies, stated its members have gone into meltdown due to the rising costs of both diesel and gasoline. This week, diesel reached a record high price while premium gasoline is approaching its all-time high. As a result of the increase, the SME Association is now calling for petroleum taxes to be reduced and the commuter allowance to be increased. The SME has issued a warning to trade unions that due to the record-high costs, there could be drastic consequences for both the economy and consumers.
In Asia, Leland Miller, chief executive of the China-focused research firm China Beige Book, stated China’s property sector slowdown is hurting economic growth, and it remains unclear whether there are new growth drivers to pick up the slack. “The major risk going forward is that as the party intentionally … deflates the property sector, what is the growth driver that will at least set a floor on growth? Nobody knows yet,” Miller wrote. This week China reported a disappointing 4.9% year-on-year growth in the third quarter. China’s ruling party has stepped up efforts to rein in heavily-indebted property developers like Evergrande, but it has yet to make enough progress in its transition to its goal of a consumption-led economy.
Japan’s economic security strategy will focus on the two pillars of “strategic autonomy and indispensability,” a top ruling party official said this week. Akira Amari, secretary general of the Liberal Democratic Party (LDP), has in recent years driven a policy push for Japan’s economy to be less reliant on other countries, while investing in areas that are indispensable to other countries. “Autonomy means understanding our chokepoints and rectifying them,” Amari said. Amari’s economic security agenda encompasses a broad portfolio of issues, from protecting sensitive technologies to communications, energy, transportation, maritime logistics, finance and healthcare.
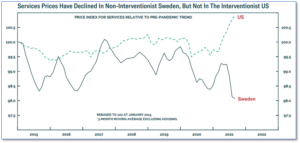
Finally: With inflation in the United States now more than double the Federal Reserve’s stated target of 2% inflation, economists have been at odds on whether this is ‘transitory’ or just the beginning of a new monetary trend. With the vast majority of the developed world instituting economic lockdowns and massive government stimulus to combat the COVID‑19 pandemic, it makes sense that this would fuel inflation in modernized countries with just-in-time supply chains, negligible spare capacity…and then sudden injections of massive stimulation from governments. However, there is one country that stood alone bucking the global trend—Sweden. That country did not mandate shutdowns or lockdowns and consequently saw no need to over-stimulate the Swedish economy since everyone was still working. Now Sweden’s services inflation level is about 3 percentage points less than the U.S., and within its “normal” range. The $64,000 question: will the US follow suit and see its inflation decline, or will the massive current and proposed stimulation continue to generate unmet demand and consequent inflation? (Chart from BCO Research, published on MarketWatch.com)
(Sources: All index- and returns-data from Yahoo Finance; news from Reuters, Barron’s, Wall St. Journal, Bloomberg.com, ft.com, guggenheimpartners.com, zerohedge.com, ritholtz.com, markit.com, financialpost.com, Eurostat, Statistics Canada, Yahoo! Finance, stocksandnews.com, marketwatch.com, wantchinatimes.com, BBC, 361capital.com, pensionpartners.com, cnbc.com, FactSet.) Securities offered through Registered Representatives of Cambridge Investment Research Inc., a broker-dealer, member FINRA/SIPC. Advisory Services offered through Cambridge Investment Research Advisors, a Registered Investment Adviser. Strategic Investment Partners and Cambridge are not affiliated. Indices mentioned are unmanaged and cannot be invested into directly. Past performance is no guarantee of future results.