
1-7-2018 Market Update
Market Update Jan. 7, 2018
The very big picture:
In the “decades” timeframe, the current Secular Bull Market could turn out to be among the shorter Secular Bull markets on record. This is because of the long-term valuation of the market which, after only eight years, has reached the upper end of its normal range.
The long-term valuation of the market is commonly measured by the Cyclically Adjusted Price to Earnings ratio, or “CAPE”, which smooths out shorter-term earnings swings in order to get a longer-term assessment of market valuation. A CAPE level of 30 is considered to be the upper end of the normal range, and the level at which further PE-ratio expansion comes to a halt (meaning that increases in market prices only occur in a general response to earnings increases, instead of rising “just because”).
Of course, a “mania” could come along and drive prices higher – much higher, even – and for some years to come. Manias occur when valuation no longer seems to matter, and caution is thrown completely to the wind as buyers rush in to buy first and ask questions later. Two manias in the last century – the 1920’s “Roaring Twenties” and the 1990’s “Tech Bubble” – show that the sky is the limit when common sense is overcome by a blind desire to buy. But, of course, the piper must be paid and the following decade or two are spent in Secular Bear Markets, giving most or all of the mania gains back.
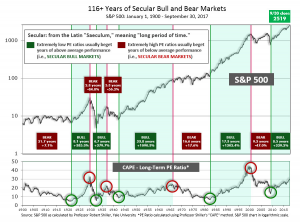
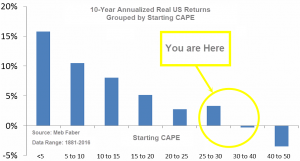
See Fig. 1 for the 100-year view of Secular Bulls and Bears. The CAPE is now at 33.27, up from the prior week’s 32.46, and exceeds the level reached at the pre-crash high in October 2007. Since 1881, the average annual return for all ten year periods that began with a CAPE around this level has been in the 0% – 3%/yr. range. (see Fig. 2).
In the big picture:
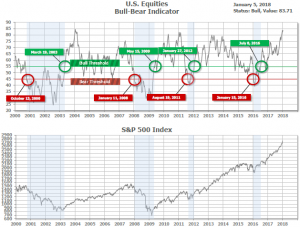
The “big picture” is the months-to-years timeframe – the timeframe in which Cyclical Bulls and Bears operate. The U.S. Bull-Bear Indicator (see Fig. 3) is in Cyclical Bull territory at 83.71, up from the prior week’s 82.57.
In the intermediate and Shorter-term picture:
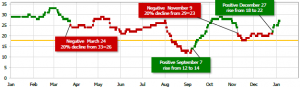
The Shorter-term (weeks to months) Indicator (see Fig. 4) turned positive on December 27th. The indicator ended the week at 27, up 2 from the prior week’s 25. Separately, the Intermediate-term Quarterly Trend Indicator – based on domestic and international stock trend status at the start of each quarter – was positive entering January, indicating positive prospects for equities in the first quarter of 2018.
Timeframe summary:
In the Secular (years to decades) timeframe (Figs. 1 & 2), unless a mania comes along the long-term valuation of the market is simply too high to sustain rip-roaring multi-year returns. The Bull-Bear Indicator (months to years) is positive (Fig. 3), indicating a potential uptrend in the longer timeframe. In the intermediate timeframe, the Quarterly Trend Indicator (months to quarters) is positive for Q1, and the shorter (weeks to months) timeframe (Fig. 4) is also positive. Therefore, with internal unanimity expressed by all three indicators being positive, the U.S. equity markets are rated as Positive.
In the markets:
U.S. Markets: U.S. stocks got off to a strong start to the new year with all of the major indexes hitting new highs during the first week. The Dow Jones Industrial Average got the most attention by passing the 25,000 threshold while the NASDAQ Composite breached 7,000. The Dow Jones Industrial Average reversed last week’s fractional loss and gained 2.33% to close at 25,295. The technology-heavy NASDAQ Composite surged 3.38% to end the week at 7,136. By market cap, large cap’s outperformed with the S&P 500 rising 2.6%, while the midcap S&P 400 and small-cap Russell 2000 added 1.9% and 1.6%, respectively.
International Markets: Canada’s TSX had its third consecutive weekly gain, up 0.9%. Across the Atlantic, the United Kingdom’s FTSE followed last week’s 1.25% gain by adding a further 0.5%. On the mainland, France’s CAC 40 reversed last week’s loss by rising 3%, while Germany’s DAX added 3.1%. Italy’s Milan FTSE surged over 4%. In Asia, China’s Shanghai Composite rose 2.6%, Japan’s Nikkei powered 4.2% higher, and Hong Kong’s Hang Seng added 3%. As grouped by Morgan Stanley Capital International, emerging markets added 4.3% while developed markets added 2.9%.
Commodities: Precious metals rallied for a fourth straight week with Gold rising 1% to $1322.30 an ounce. Silver, likewise, added 0.8% to close at $17.28 per ounce. Energy continued to rise for a third straight week with West Texas Intermediate crude oil now going for $61.44 a barrel, a gain of 1.7%. Bucking the trend, the industrial metal copper, seen by some analysts as an indicator of global economic growth due to its variety of uses slipped -2.15%–its first down week in four.
U.S. Economic News: The number of people seeking first-time unemployment benefits rose by 3,000 to 250,000 in the final week of 2017, according to the Labor Department. The more stable monthly average of claims rose 3,500 to 241,750. Both numbers remain far below the key 300,000 threshold that analysts use to indicate a “healthy” jobs market. Initial claims have remained under 300,000 for 147 consecutive weeks, its longest stretch since 1970. Continuing claims, which counts the number of people already receiving benefits, fell by 37,000 to 1.91 million. That number is reported with a one-week delay. The unemployment rate remained unchanged at 4.1%.
Payroll processor ADP reported the number of private-sector jobs increased by 250,000 last month, blowing away economists’ expectations of 188,000. Mark Zandi, chief economist for Moody’s Analytics stated, “The American job machine remains in full swing” and described the current rate of job growth as “unprecedented”. In the details, almost all of the gain was in the services sector, which accounted for 222,000 of the jobs. The trade/transportation/utilities category made up 45,000, a sign of the continued impact the growth of e-commerce is having on the job market. Zandi expects the momentum will continue into 2018, forecasting a gain of 2 million jobs this year, and that the jobless rate will decline further to the mid-3% range.
Manufacturing activity surged last month, according to the latest data from the Institute for Supply Management (ISM) manufacturing index. The ISM index rose 1.5 points to 59.7—the second highest reading in a year. The uptick in the index exceeded analysts’ expectations. In the details, sixteen of the eighteen industries tracked reported growth. Production rose 1.9 points to 65.8, while new orders jumped 5.4 points to 69.4–its fastest pace since January 2004. The only weak spot in the report was in the employment index which saw a slight drop to 57 from 59.7. Manufacturing is likely to get a boost this year from the $1.5 trillion tax cut approved by the Republican-controlled U.S. Congress last month. Manufacturing accounts for about 12% of the U.S. economy.
The strong ISM manufacturing reading was reinforced by IHS Markit’s manufacturing Purchasing Managers Index (PMI) which hit its highest level since March 2015. IHS Markit’s manufacturing PMI rose 1.2 points to 55.1 in December signaling solid improvement in the health of the sector. Output at manufacturers reached an 11-month high, with respondents attributing the increased production to more favorable demand conditions and increased new orders. In addition, conditions appear positive for the coming year. Chris Williamson, chief business economist at IHS Markit stated, “With business optimism about the year ahead running at its highest for two years in the closing months of 2017, companies are clearly expecting to be busier in 2018. The upbeat mood is underscored by an increased appetite to hire new staff, with the survey indicating that factory payroll numbers are rising at a rate not seen for over three years.”
In the services sector, the ISM non-manufacturing index slipped 1.5 points to 55.9 last month, the second down month in a row following the 12-year high set in October. In the release, ISM stated, “the majority of respondents’ comments indicate that they finished the year on a positive note. They also indicate optimism for business conditions and the economic outlook going forward.” In the details of the report, the new orders sub-index slid 4.4 points to 54.3, signaling slower activity in the future. Both the jobs and gauge of prices paid sub-indexes ticked up, 1 point and 0.1 points, respectively. Ian Shepherdson, chief economist for Pantheon Macro stated that December’s reading “looks more like a correction than the start of a trend decline”, noting that October’s and November’s readings “always looked too high to be sustained.”
Spending on construction projects rose 0.8% to an all-time high of $1.257 trillion in November according to the Commerce Department. Year-over-year construction spending was up 2.4%. In the details, private residential projects surged 1% to its highest level since February 2007, following a 0.3% increase in October. The increase was in line with the jump in homebuilding activity. On non-residential structures, spending rebounded 0.9% in November after a 0.2% decline in the prior month. Overall, spending on private construction projects increased 1.0% to a record high. Spending on public construction projects rose 0.2% in November after October’s 3.5% surge. State and local government projects increased 0.7%, while Federal construction spending fell -4.8%.
According to the latest minutes from the Federal Reserve’s Open Market Committee meeting, the Fed is still forecasting three rate hikes for this year, but the minutes show a distinct lack of unity with the projection. The minutes reveal essentially two viewpoints, of roughly the same size, that are both uncomfortable with the forecast—but for completely different reasons. On the dovish side, one camp believes that three rate hikes this year might be too aggressive; arguing that three rate hikes might prevent a “sustained” return to the Fed’s 2% inflation target. They felt interest rates didn’t have much further to rise before reaching the level that would no longer be “accommodative” for growth. The other, more hawkish camp, thought the forecast was too slow, noting that financial conditions had not tightened since the Fed started raising rates at the end of 2015 and that continued low rates risked financial instability. Currently, investors have pegged an approximately 70% chance of a rate hike at the central bank’s meeting in March.
International Economic News: Canadians haven’t been this confident about the economy since the Great Recession. The latest Bloomberg-Nanos consumer confidence index hit a level of 62.17, its highest level since the all-time high of 62.92 set at the end of 2009. The current mood is no surprise considering Canada’s robust jobs market. Canada’s unemployment rate fell to 5.9% in November– its lowest level in nearly a decade. In addition, wages have grown for 12 straight months. The recovery in energy prices is making consumers in the “Prairie provinces” more confident, according to pollster Nik Nanos. The province of Canada with the greatest economic optimism is Quebec, where the jobless rate is near all-time lows. Bloomberg suggested that the apparent arrival of foreign buyers in Montreal’s housing market may also be boosting consumer confidence in Quebec.
Across the Atlantic, Britain’s economy picked up speed at the end of last year and businesses were more upbeat regarding next year according to the latest IHS Markit/CIPS surveys of businesses. The survey signaled Britain’s economy likely grew 0.4-0.5% in the fourth quarter, slightly faster than the previous quarter—but the survey also suggested growth in Britain’s economy lagged that of the Eurozone during the same period. The economy largely withstood the immediate shock of the referendum decision in 2016 to leave the EU, but 2017 was a bit more difficult due to higher inflation.
On Europe’s mainland, French Economy and Finance Minister Bruno Le Maire said in an interview that France was looking to China and Russia to act as a “counterweight” to increasingly uncertain trade relations with the U.S. and Britain. The remarks are a further sign of how European powers are re-evaluating their traditional post-World War II ties. Mr. Le Maire stated, “We are moving from a world dominated by very exclusive trans-Atlantic relations towards a rebalancing.” According to Mr. Le Maire, France is looking to build a trade network that runs from Europe to Beijing via Moscow. French President Emmanuel Macron plans to launch this effort when he makes his first visit to China in January and attends the St. Petersburg International Financial Congress—Russia’s answer to the annual World Economic Forum in Davos, Switzerland.
In Germany, the number of people employed hit its highest-ever level at the end of 2017 and the unemployment rate fell to a record low, reflecting the economic boom in Europe’s largest economy that could push up wages and inflation. The jobless rate fell to 5.5% last month, its sixth consecutive decline according to the Federal Labor Agency. Germany’s economy has been on a strong footing, supported by domestic spending and solid global trade. Jens Kramer, an economist at NordLB in Hanover noted, “People are not afraid to spend money because unemployment is so low and that boosts domestic demand.” Kramer found it notable that wage growth continued to be “so moderate” after seeing effectively full employment for two years in Germany.
Top Chinese officials at the Communist Party’s Central Economic Work Conference decided to maintain China’s economic growth target for 2018 at “around 6.5%”, the same as last year. The forecast matched economists’ estimates. At the work conference, Chinese leaders criticized regulators and finance officials for not having done enough to prevent disorder in financial markets, the buildup in leverage and the growth of local debt. In addition, the group announced a three-year campaign to reign in financial risk, limit pollution, and reduce poverty. The world’s second-largest economy surpassed last year’s growth goal, coming in at 6.7% in the fourth-quarter.
Top Japanese business leaders are feeling more optimistic about the prospects for that nation’s economy during the upcoming year according to a recent survey. Yomiuri Shimbun surveyed the leaders of 30 major companies in Japan. Of the 30 surveyed, 28 reported that the economy is “recovering moderately”, and 26 predicted the economy will “recover moderately” in the next six months. The survey showed that a bright outlook is seen by almost all business sectors. Four holdout respondents predicted the economy would be at a “standstill” six months from now. Regarding predictions for 2018, 27 respondents stated they expected to see real economic growth of 1.0 to 1.5%. Japan’s government prediction is for a growth rate of 1.8% for fiscal 2018.
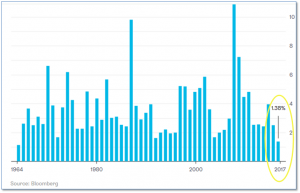
Finally: Bloomberg columnist and market analyst Barry Ritholtz noted that last year’s technical state of the market was “just plain weird”. Although 2017 was very volatile news-wise, what with daily Trump tweets, North Korean missile tests and a steady stream of terrorist attacks around the world, U.S. stock market volatility was its lowest in fifty years. Normally, markets are regularly rocked by headlines from around the world, but Ritholtz found you have to go back to 1964 to find a year with as small a maximum daily change as 2017. In addition, the S&P 500 total return index finished up every single month in a row for the last 13 months, another multi-decade record. The disconnect between the news and the markets was very unusual indeed – “just plain weird”.
(sources: all index return data from Yahoo Finance; Reuters, Barron’s, Wall St Journal, Bloomberg.com, ft.com, guggenheimpartners.com, zerohedge.com, ritholtz.com, markit.com, financialpost.com, Eurostat, Statistics Canada, Yahoo! Finance, stocksandnews.com, marketwatch.com, wantchinatimes.com, BBC, 361capital.com, pensionpartners.com, cnbc.com, FactSet)
Indices mentioned are unmanaged and cannot be invested into directly. Past performance is no guarantee of future results. All Investing involves risk. Depending on the types of investments, there may be varying degrees of risk. Investors should be prepared to bear loss, including total loss of principal.