
1-15-2018 Market Update
Market Update Jan. 15, 2018
The very big picture:
In the “decades” timeframe, the current Secular Bull Market could turn out to be among the shorter Secular Bull markets on record. This is because of the long-term valuation of the market which, after only eight years, has reached the upper end of its normal range.
The long-term valuation of the market is commonly measured by the Cyclically Adjusted Price to Earnings ratio, or “CAPE”, which smooths out shorter-term earnings swings in order to get a longer-term assessment of market valuation. A CAPE level of 30 is considered to be the upper end of the normal range, and the level at which further PE-ratio expansion comes to a halt (meaning that increases in market prices only occur in a general response to earnings increases, instead of rising “just because”).
Of course, a “mania” could come along and drive prices higher – much higher, even – and for some years to come. Manias occur when valuation no longer seems to matter, and caution is thrown completely to the wind as buyers rush in to buy first and ask questions later. Two manias in the last century – the 1920’s “Roaring Twenties” and the 1990’s “Tech Bubble” – show that the sky is the limit when common sense is overcome by a blind desire to buy. But, of course, the piper must be paid and the following decade or two are spent in Secular Bear Markets, giving most or all of the mania gains back.
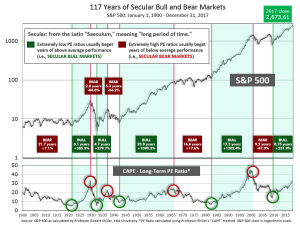
See Fig. 1 for the 100-year view of Secular Bulls and Bears.
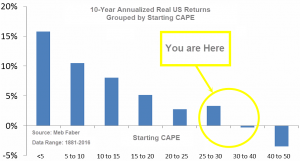
The CAPE is now at 33.80, up from the prior week’s 33.27, and exceeds the level reached at the pre-crash high in October 2007. This value is at the lower end of the “mania” range. Since 1881, the average annual return for all ten year periods that began with a CAPE around this level has been in the 0% – 3%/yr. range. (see Fig. 2).
In the big picture:
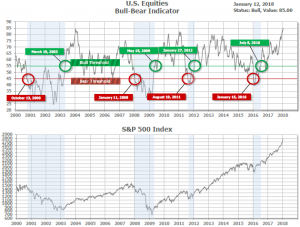
The “big picture” is the months-to-years timeframe – the timeframe in which Cyclical Bulls and Bears operate. The U.S. Bull-Bear Indicator (see Fig. 3) is in Cyclical Bull territory at 85.00, up from the prior week’s 83.71.
In the intermediate and Shorter-term picture:
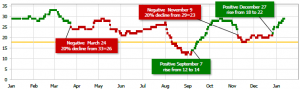
The Shorter-term (weeks to months) Indicator (see Fig. 4) turned positive on December 27th. The indicator ended the week at 29, up 2 from the prior week’s 27. Separately, the Intermediate-term Quarterly Trend Indicator – based on domestic and international stock trend status at the start of each quarter – was positive entering January, indicating positive prospects for equities in the first quarter of 2018.
Timeframe summary:
In the Secular (years to decades) timeframe (Figs. 1 & 2), the long-term valuation of the market is simply too high to sustain rip-roaring multi-year returns – but the market has entered the low end of the “mania” range, and all bets are off in a mania. The only thing certain in a mania is that it will end badly…someday. The Bull-Bear Indicator (months to years) is positive (Fig. 3), indicating a potential uptrend in the longer timeframe. In the intermediate timeframe, the Quarterly Trend Indicator (months to quarters) is positive for Q1, and the shorter (weeks to months) timeframe (Fig. 4) is also positive. Therefore, with internal unanimity expressed by all three indicators being positive, the U.S. equity markets are rated as Positive.
In the markets:
U.S. Markets: U.S. stocks recorded a second week of solid gains in the new year as investors took in fourth-quarter earnings reports and celebrated some strong economic data. The Dow Jones Industrial Average added another 2% to last week’s rise closing up 507 points to 25,803. The technology-heavy NASDAQ Composite rose 124 points to close at 7,261, a gain of 1.7%. By market cap, small caps led the way with a 2% gain for the Russell 2000, followed by the large-cap S&P 500 index, up 1.6%, and the mid-cap S&P 400 index, up 1.5%.
International Markets: Canada’s TSX slipped a quarter of a percent, while across the Atlantic the United Kingdom’s FTSE gained 0.7%. On Europe’s mainland major markets were mixed. France’s CAC 40 rose 0.85%, and Italy’s Milan FTSE gained 2.9%, while Germany’s DAX retreated half a percent. In Asia, it was a similar story. Hong Kong’s Hang Seng added 1.9% to last week’s gain, along with China’s Shanghai Composite which rose 1.1%. Japan’s Nikkei closed down -0.26% following the prior week’s huge 4.2% surge. As grouped by Morgan Stanley Capital International, developed markets outpaced emerging markets by rising 1.6%, while emerging markets added 0.8%.
Commodities: Precious metals were mixed with Gold rising 0.95% to $1334.90 an ounce, while the traditionally more volatile Silver slipped -0.83% to $17.14 an ounce. In energy, West Texas Intermediate crude oil surged over 4.6% to close at $64.30 a barrel, while North Sea Brent crude rose 3.1% to $69.87 a barrel. The industrial metal copper, viewed by some analysts as an indicator of worldwide economic health due to its variety of uses, retreated -0.34%.
U.S. Economic News: The number of workers seeking initial unemployment benefits climbed by 11,000 to a nearly 4-month high of 261,000 last week, according to the Labor Department. The reading was the highest since the middle of September and well above the 248,000 forecast by economists. Volatility following the holiday season is not uncommon, with cutbacks of workers hired for temporary holiday-season jobs. The less-volatile monthly average of claims rose by 9,000 to 250,750. Continuing claims, which counts the number of people already receiving benefits, fell by 35,000 to 1.87 million. Overall, the U.S. labor market is starting the new year in its best shape in almost two decades. The nation’s unemployment rate sits at a 17-year low of 4.1%.
The number of job openings in the U.S. fell to a six-month low of 5.88 million in November, but it appears to be due to a surge in hiring that took place in the last few months of 2017. The Labor Department reported 5.5 million people were hired in November, the second largest increase in hiring since the end of the Great Recession. In the details, hiring in the “other services”, transportation, warehousing, and real estate categories all rose sharply in November. Companies still report that their biggest problem is a shortage of skilled labor. The U.S. created more than 2 million jobs in 2017 for the seventh year in a row, reflecting the second biggest hiring streak since World War II.
Sentiment among the nation’s small business owners slipped last month at the end of the strongest year on record, according to the National Federation of Independent Businesses (NFIB). The index of small-business optimism fell 2.6 points to 104.9 in December, but a slight pullback was expected—November’s reading was the index’s second highest level on record. In the details of the report, only the “Plans to Make Capital Outlays” and “Current Job Openings” sub-indexes posted gains, while all others were either flat or negative. Small businesses have been encouraged by the more business-friendly tone out of Washington. NFIB chief economist Bill Dunkelberg stated, “The 2016 election was like a dam breaking. Small-business owners were waiting for [more accommodating] policies from Washington, suddenly they got them, and the engine of the economy roared back to life.”
The cost of goods at the wholesale level fell last month for the first time in nearly a year and a half, according to the Labor Department. The Labor Department said its Producer Price Index (PPI) for final demand ticked down 0.1% in November—its first drop since August 2016. On an annualized basis, the PPI was up 2.6% in December, down from 3.1% in November. In the details, a decline in the cost of services was responsible for the downtick. Excluding food, energy, and trade services, core PPI ticked up 0.1%. On an annualized basis core PPI rose 2.3% through December. Economists note that the weaker PPI may weigh on inflation pressures going into the new year.
At the consumer level, higher rents and home prices were the prime causes of higher consumer prices last month. The Bureau of Labor Statistics reported the Consumer Price Index (CPI) rose a modest 0.1% last month with the majority of the increase due to the higher cost of housing. Stripping out gas and food, the so-called core rate of inflation rose a much sharper 0.3%–its highest reading in almost a year. The 12-month rate of inflation ticked down -0.1% to 2.1%. Core CPI on an annualized basis rose slightly to 1.8%. Jim Baird, chief investment officer at Plante Moran Financial Advisors stated, “Inflation has held relatively steady since late summer even as overall economic growth roared back.”
The cost of goods imported into the United States rose slightly last month, finishing the year with a 3% increase—its biggest gain in six years. The Bureau of Labor Statistics reported its Import Price index ticked up 0.1% following an increase in oil prices at the end of last year. Ex-energy, however, import prices actually fell -0.1% in December. Energy prices have a big impact on overall import inflation and accounted for the majority of the increase in 2017. Energy aside, the prices of other imports were up just 1.4% last year—still quite low by historical standards.
Sales at the nation’s retailers rose 0.4% in December marking their fourth consecutive gain monthly gain. Holiday sales put a spotlight on the growing divide between surging internet retailers and old-fashioned brick-and-mortar department stores. Sales at internet retailers jumped 1.2% in December, while department store sales tumbled by 1.1%–their biggest decline in a year and a half. Online sellers have been taking market share away from traditional retailers for years as Americans shift to shopping online. Following internet retailers, restaurants, home and garden centers, and home furnishings stores all performed well. Overall, the 2017 holiday season was quite good.
International Economic News: An internal memo to Canada’s finance minister from staff economists stated that while Canada is coming off a stellar year of economic growth, Canada’s economy is set to “wane”. The note for Finance Minister Bill Morneau forecasts average annual growth of just 1.7% this year through to 2022. The slower growth number has big implications for federal tax receipts and annual deficits—and suggests Morneau will have to be more conservative with spending in Canada’s budget for this year. Canada’s economy has been especially robust for about a year, averaging 3.7% growth, while the jobless rate recently hit a record low. The note, ordered by Morneau using internal economic analysis stated, “This very rapid pace of growth is not sustainable going forward as … transitory factors start to wane and interest rates will likely continue rising.”
In the UK, private think tank National Institute of Economic and Social Research (NIESR) reported the United Kingdom economy grew by 0.6% in the final quarter of 2017, up from 0.4% in the previous three months. The UK economy is on course to record its fastest growth rate since late 2016 and has had its longest spell of rising factory output in 23 years. Amit Kara, NIESR’s head of UK macroeconomic forecasting, said activity had picked up in the second half of the year following a weak start. “The recovery has been driven by both the manufacturing and the service sectors, supported by the weaker pound and a buoyant global economy, though construction output continues to lag,” Kara said. NIESR believes the stronger than expected performance of the economy, coupled with inflation above the 2% target, will lead to the Bank of England raising interest rates by a quarter point to 0.75% in May, with further increases every six months until mid-2021.
French union and business leaders have begun negotiations to overhaul France’s unemployment insurance rules, part of President Emmanuel Macron’s plan to modernize France’s welfare state and lower the country’s relatively high jobless rate. Mr. Macron pledged to extend unemployment insurance to the self-employed and to allow workers who resign to set up their own company to receive benefits. In exchange for tighter unemployment insurance controls, the French president has earmarked a 15 billion euro spending program to train the jobless. Mr. Macron is proposing a “flexisecurity” plan, which is a Nordic-style economic plan that makes it easier for companies to hire and fire but provides state support for workers between jobs.
Germany’s economy grew 2.2% last year—its fastest rate of expansion in 6 years. German statistics agency Destatis reported the expansion was in line with forecasts and driven primarily by big increases in the rate of growth in investments and exports. Growth was almost a full percentage point higher than the 1.3% annual average recorded over the past 10 years. In addition, Germany’s public finances posted a record surplus, fueling hopes for another strong showing next year. ING Diba bank economist Carsten Brzeski noted it was “a strong performance by an economy firing on all cylinders.” He added that the same fundamentals which supported growth in 2016 and 2017 should still be in place in 2018.
Italian voters will be heading to the polls on March 4 where former Prime Minister Silvio Berlusconi will square off against the populist, anti-establishment Five Star Movement candidate Beppe Grillo. Italy continues to be the underperformer on the continent with a crushing debt load (130% of GDP) and the second-highest unemployment rate in Europe, just below Greece. In contrast to the Eurozone average of 8.7% unemployment, Italy’s rate was 11% in January. Even worse, youth unemployment is over 30% forcing Italy’s best and brightest to go to Germany, Britain, Canada, and other low unemployment countries to find work. This election is particularly important. As the Eurozone’s third-largest economy, when it bogs down so does the rest of the Eurozone. And following Brexit, the last thing Germany and France want to see is another big member-state wanting to leave the European Union.
In Asia, China’s Premier Li Keqiang was upbeat on the Chinese economy, stating growth was about 6.9% in 2017 – higher than most market forecasts. The predicted figure would mark a rise from the 26-year low in annual GDP growth recorded in 2016 and exceeds economist forecasts of a 6.8% rise in 2017. The official figures are due to be released by China’s National Bureau of Statistics on January 18th. China’s economy posted strong results in the fourth quarter due to a construction boom and robust global demand for Chinese exports. Li said the unemployment rate in the country’s big cities was the lowest it had been for many years and that “the two-year fall in exports has been reversed”. The upbeat assessment was mirrored by private economists as well. Ding Shuang, chief Greater China economist at Standard Chartered Bank, said the Chinese economy was performing better than expected, boosted by an improved outlook for global growth and demand for Chinese goods and services.
The Bank of Japan’s December Tankan, or “Short-Term Economic Survey of Enterprises”, reported confidence in the Japanese economy is surging among Japanese businesses both large and small. Among large manufacturers, overall assessment of business conditions improved for the fifth straight quarter hitting an 11-year high of 25. Among small and medium-sized businesses, the confidence index reached 15—its highest level since 1991. Japan had its seven straight quarter of economic expansion, with the third quarter rising at an annualized rate of 2.5%. It was Japan’s longest quarterly growth streak since the government began compiling statistics in 1994.
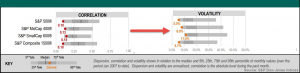
Finally: As has been noted by one and all, 2017 was a year of amazingly low volatility and completely absent of pullbacks of any significance. But why? Standard & Poors (S&P) has documented what could be the hidden answer: extremely low correlations among stocks. In more usual times, stocks tend to move together, like the birds of a flock in flight. But in 2017, correlation was at record lows, meaning that fewer and fewer stocks were moving together, and more and more were zigging while others were zagging. This has the net effect of dampening overall volatility, as the opposing moves offset one another in the aggregate. “Record low correlations accompanied the relative lack of market swings, and indeed may be seen as a causal factor,” S&P wrote in its research report. “Markedly different reactions to the year’s major events created stronger diversification effects, dampening volatility in the benchmarks.”
(sources: all index return data from Yahoo Finance; Reuters, Barron’s, Wall St Journal, Bloomberg.com, ft.com, guggenheimpartners.com, zerohedge.com, ritholtz.com, markit.com, financialpost.com, Eurostat, Statistics Canada, Yahoo! Finance, stocksandnews.com, marketwatch.com, wantchinatimes.com, BBC, 361capital.com, pensionpartners.com, cnbc.com, FactSet)
Indices mentioned are unmanaged and cannot be invested into directly. Past performance is no guarantee of future results. All Investing involves risk. Depending on the types of investments, there may be varying degrees of risk. Investors should be prepared to bear loss, including total loss of principal.