
Market Update 12/29/17
December 29,2017 Market Update
The very big picture:
In the “decades” timeframe, the current Secular Bull Market could turn out to be among the shorter Secular Bull markets on record. This is because of the long-term valuation of the market which, after only eight years, has reached the upper end of its normal range.
The long-term valuation of the market is commonly measured by the Cyclically Adjusted Price to Earnings ratio, or “CAPE”, which smooths out shorter-term earnings swings in order to get a longer-term assessment of market valuation. A CAPE level of 30 is considered to be the upper end of the normal range, and the level at which further PE-ratio expansion comes to a halt (meaning that increases in market prices only occur in a general response to earnings increases, instead of rising “just because”).
Of course, a “mania” could come along and drive prices higher – much higher, even – and for some years to come. Manias occur when valuation no longer seems to matter, and caution is thrown completely to the wind as buyers rush in to buy first and ask questions later. Two manias in the last century – the 1920’s “Roaring Twenties” and the 1990’s “Tech Bubble” – show that the sky is the limit when common sense is overcome by a blind desire to buy. But, of course, the piper must be paid and the following decade or two are spent in Secular Bear Markets, giving most or all of the mania gains back.
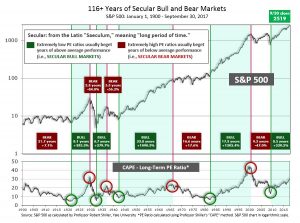
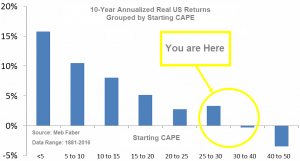
See Fig. 1 for the 100-year view of Secular Bulls and Bears. The CAPE is now at 32.46, down slightly from the prior week’s 32.56, and exceeds the level reached at the pre-crash high in October, 2007. Since 1881, the average annual return for all ten year periods that began with a CAPE around this level have been in the 0% – 3%/yr. range. (see Fig. 2).
In the big picture:
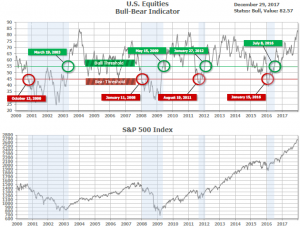
The “big picture” is the months-to-years timeframe – the timeframe in which Cyclical Bulls and Bears operate. The U.S. Bull-Bear Indicator (see Fig. 3) is in Cyclical Bull territory at 82.57, down from the prior week’s 83.63.
In the intermediate and Shorter-term picture:
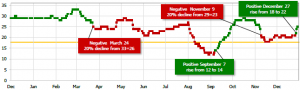
The Shorter-term (weeks to months) Indicator (see Fig. 4) turned positive on December 27th. The indicator ended the week at 25, up 4 from the prior week’s 21. Separately, the Intermediate-term Quarterly Trend Indicator – based on domestic and international stock trend status at the start of each quarter – was positive entering January, indicating positive prospects for equities in the first quarter of 2018.
Timeframe summary:
In the Secular (years to decades) timeframe (Figs. 1 & 2), unless a mania comes along the long-term valuation of the market is simply too high to sustain rip-roaring multi-year returns. The Bull-Bear Indicator (months to years) is positive (Fig. 3), indicating a potential uptrend in the longer timeframe. In the intermediate timeframe, the Quarterly Trend Indicator (months to quarters) is positive for Q1, and the shorter (weeks to months) timeframe (Fig. 4) is now also positive. Therefore, with internal unanimity expressed by all three indicators being positive, the U.S. equity markets are rated as Positive.
In the markets:
U.S. Markets: U.S. stock benchmarks fell modestly amid very light trading in the holiday-shortened week. Mid-cap stocks outperformed both large caps and small caps, while the technology-heavy NASDAQ Composite fared the worst. The Dow Jones Industrial Average gave up 34 points this week to end the year at 24,719—a loss of ‑0.14%. The NASDAQ Composite fell 56 points to close at 6,903, a loss of -0.8%. By market cap, the small cap Russell 2000 ended down -0.48%, while the large cap S&P 500 retreated -0.36% and mid cap S&P 400 fell by a lesser -0.21%.
International Markets: Canada’s TSX rose for a second straight week, adding 0.27%. The United Kingdom’s FTSE added another 1.25% (benefiting from a slipping British Pound), while on Europe’s mainland France’s CAC 40 fell ‑0.97%, Germany’s DAX retreated -1.2%, and Italy’s Milan FTSE lost -1.6%. In Asia, China’s Shanghai Composite rose a second week, adding 0.3%, while Japan’s Nikkei fell -0.6%. Hong Kong’s Hang Seng index rose another 1.15% following last week’s strong gains.
Commodities: Precious metals rallied a third straight week. Gold surged $30.50/oz. to close at $1,309.30/oz., a gain of 2.4%. Silver, which traditionally trades in the same direction as gold but with wider swings, rose 4.3%. In energy, oil rose 3.34% to close at $60.42 per barrel of West Texas Intermediate crude oil. The industrial metal copper rose a third straight week, picking up 1.9%.
December summary: In the U.S., bigger was better (continuing the year’s dominant theme). The Mega-Cap Dow Jones 30 Industrials rose 1.84%, the Large Cap S& 500 added 0.98%, but the Mid Cap S&P 400 barely budged with a gain of just 0.07%, and the Small Cap Russell 2000 lost ground, retreating -0.56% International stock indices were also mixed. For the month, Canada’s TSX added 0.88% and the United Kingdom’s FTSE surged a whopping 4.9%. But on Europe’s mainland, France’s CAC 40 retreated -1.1%, Germany’s DAX fell a lesser -0.8%, and Italy’s Milan FTSE slumped -2.3%. In Asia, China’s Shanghai Composite fell -0.3%, but Japan’s Nikkei rose 0.18%, and Hong Kong’s Hang Seng added 2.54%. Many commodities finished the year strongly, with Gold adding 2.22% in December, Silver rose 1.35%, Copper surged 7.84% and Crude Oil gained 4.61%
Q4 summary: US stocks were paced by the Dow 30 Industrials, gaining 10.33% for the quarter, followed by the NASDAQ Composite, which gained 6.27%. Other quarterly returns followed the 2017 pattern of Large, Mid and Small, in descending order: Large Cap S&P 500 rose 6.12%, the Mid Cap S&P 400 gained 5.83%, and the Russell 3000 brought up the rear with a gain of 2.99%. Leading major international market Q4 gains were Japan’s Nikkei 225 which rocketed higher by 11.83%, followed by the Hong Kong Hang Seng Index with a gain of 8.58%, Canada’s TSX, which rose 5.49%, and the UK’s FTSE 100, which gained 4.27%. Germany’s DAX was slightly positive at 0.68%, but France’s CAC40 dropped a slight -0.3% and Italy’s MIB lost -3.7%.
2017 summary: Led by the NASDAQ Composite, all the major U.S. stock indexes recorded solid gains for the year, with large-cap stocks generally performing better than smaller-caps. For the year, the Dow Jones Industrial Average surged 25.08%, while the NASDAQ Composite rocketed 28.24%. The large cap S&P 500 rose 19.42%, the mid cap S&P 400 added 14.5%, and the small cap Russell 2000 rose 13.14%. International major markets also prospered in 2017, but only Hong Kong’s Hang Seng index surpassed the Dow, rising 36%. Canada’s TSX rose 6% and the United Kingdom’s FTSE added 7.6%. In Europe, France’s CAC 40 added 9.26%, Germany’s DAX gained 12.5%, and Italy’s Milan FTSE rose 13.6%. In Asia, China’s Shanghai Composite added 6.56% and Japan’s Nikkei surged 19.1% and the aforementioned Hong Kong Hang Seng Index rocketed 36% higher. Gold gained 12.8% for the year, while Silver lagged rising just 5.8%, and Crude Oil finished 2017 up 12.5%.
U.S. Economic News: The number of Americans filing for new unemployment benefits remained unchanged last week, keeping the underlying trend consistent with a tight labor market. The Labor Department reported there were 245,000 claims for state unemployment benefits last week. Since mid-October, claims have remained between 223,000 and 252,000—well below the key 300,000 threshold that analysts use to indicate a “healthy” jobs market. Last week marked the 147th consecutive week that claims have remained below the 300,000 level. The labor market is widely viewed as being near “full employment”, with the jobless rate at a 17-year low of 4.1%. Continuing claims, which counts the number of people already receiving unemployment benefits, increased by 7,000 to 1.94 million.
The National Association of Realtors (NAR) reported that pending home sales, in which a contract has been signed but not yet closed, ticked up 0.2% last month, missing economists’ forecasts for a 0.5% increase. In its statement, the NAR reported that the housing market’s biggest headwind remains “extremely lean levels of inventory” for sale. Last month, the NAR reported that November had just 3.4 months’ worth of homes for sale—the lowest going back to 1999. NAR Chief Economist Lawrence Yun said, “New buyers coming into the market are finding out quickly that their options are limited and competition is robust.” By region, pending sales were mixed. In the Northeast, pending sales rose 4.1%, while in the Midwest sales were up 0.4%. However, sales dipped -0.4% in the South, and fell -1.8% in the West.
Home prices remained near their highs, up 6.2% from the same time last year, according to the S&P Case-Shiller Home Price Index. The Case-Shiller national index rose a seasonally adjusted 0.7% in the three-month period ending in October. The more narrowly-focused 20-city index also rose a seasonally adjusted 0.7% in October and is up 6.4% for the year. Led by San Francisco and Las Vegas, prices rose in more than half of the largest U.S. markets. Overall, the national index is now 6% above its prior year-to-year peak, while the 20-city index sits just 1.3% below its all-time high. David Blitzer, chairman of the index committee at S&P Dow Jones Indices stated, “Home prices continue their climb supported by low inventories and increasing sales. Underlying the rising prices for both new and existing homes are low interest rates, low unemployment and continuing economic growth.”
Confidence among the nation’s consumers slipped slightly this month just off the 17-year high it reached in November. The Conference Board reported its index fell 6.5 points to 122.1 this month; economists had expected a reading of 127.5. In the details, respondents were a little less confident in their outlook for jobs and business conditions. However, consumers were much more pleased with their current conditions. The “present” situation index rose 1.7 points to 156.6, its highest level since 2001. Only 15.2% of Americans reported jobs were “hard to get”—a 16-year low. Lynn Franco, director of economic indicators at the board remarked, “Despite the decline in confidence, consumers’ expectations remain at historically strong levels, suggesting economic growth will continue well into 2018.”
The Chicago-area Purchasing Managers Index (PMI) rose 3.7 points to 67.6 this month, reaching its highest level since March 2011. December also marked the fourth consecutive month that the Chicago Business Barometer had a reading above 60—the first such occurrence since 2014. Among the components of the PMI, output and demand posted strong gains in the latest month, with both hitting multi-year highs. Production matched the highest level in 34 years while new orders rose to a three-and-a-half year high. Each month the survey asks a new, unique question. According to the latest report, this month’s question asked firms to predict how both their businesses and the U.S. economy would fare in the coming year. Just over 50% saw their business growing somewhere between 0-5%, with 37% forecasting growth between 5-10%, for a total of 87% in the growth camp.
International Economic News: In Canada, economic bulls received an early Christmas courtesy of a couple of positive economic reports. Both wholesale trade figures and retail sales rose 1.5% in October, with all provinces recording gains. Michael Dolega, senior economist at TD Bank stated, “The two reports suggest that consumers were out in full force ahead of the most important weeks for retailers.” The positive numbers gave a slight increase to the odds of an interest rate hike in January. On a somewhat negative note, October’s GDP report came in unchanged from the previous month. Statistics Canada reported goods-producing industries were down 0.4% from September while service-producing industries rose 0.2%. Compared with the same time last year, Canada’s GDP was up a robust 3.4% overall.
Across the Atlantic, according to the United Kingdom’s Office for National Statistics, economic growth was 0.4% in the third quarter, matching expectations. The result was a 0.1% increase over the previous quarter. In the details, household consumption rose at a faster pace and contributed the most to the UK’s economic growth, however growth in fixed investments stalled. On annualized basis, the UK’s gross domestic product improved by 1.6% from the same time last year. In a separate report, the Office for National Statistics reported that inflation in the U.K. is on the rise. Inflation rose by 0.3% last month, following a 0.1% rise in October. Overall, inflation in the United Kingdom was up 3.1% on a yearly basis last month—the highest reading since March 2012.
On Europe’s mainland, French President Emmanuel Macron has regained his footing in national polls following a rocky start to his presidency some seven months ago. A string of French polls show a clear surge in his popularity following a plunge to a near record low for a newly elected president over the summer. Macron had immediately set to revamp France’s extensive labor laws to make the country more economically competitive on the global stage. Surveys by Ifop, BVA, and Odoxa Institutes all showed a clear jump, with 52% of French citizens saying they are “satisfied” or have a “good opinion” of Macron, up from around 40% in November. Macron has re-asserted France as a prominent country on the international scene by taking the lead on the Paris climate accord, inviting London-based international companies to move to Paris following the Brexit vote, and maintaining France’s military involvement in the battle against the Islamic State in Iraq and Syria.
In Germany, the European Central Bank (ECB) now has a dilemma on its hands as German inflation hit its highest level in more than five years. Initial data showed that prices in Europe’s largest economy rose by 0.8% in December, faster than the 0.6% increase expected. Over the past year, German prices rose an average 1.7% in “harmonized terms”—its largest increase since 2012 when inflation hit 2.1%. Consumer prices are “harmonized” to make them compatible with inflation data in other European Union countries. The German data will give hawkish ECB members more arguments in favor of unwinding the ECB’s 2.55 trillion euro bond-buying program. Some economists say the ECB’s low interest rate environment risks causing the German economy to overheat.
Chinese industrial firms continued to increase production in the fourth quarter, but growth in wages and hiring is slowing according to a quarterly survey of thousands of Chinese firms by China Beige Book International (CBB). The CBB found that while “old economy” firms in the commodities sector sustained an increase in net capacity and production, the retail sector suffered from weak revenue, a slowdown in hiring, and a worsening cash flow situation. The results support views that China’s economy will slacken in 2018 after posting better-than-expected 6.9% growth through the first three quarters of this year. Much of this year’s performance was supported by robust exports, a construction boom, and a government-led infrastructure spending spree.
Japan’s unemployment rate dipped to its lowest level since November 1993 offering fresh evidence that the world’s third-largest economy is on track to recovery, official data showed. Unemployment stood at 2.7% in November while the jobs-to-applicants ratio improved slightly to 1.56:1 — its highest level in 44 years! The data comes as Japan has attained seven consecutive quarters of economic growth—its longest positive run in 16 years. In addition, the upward trend is expected to continue. Masaki Kuwahara, senior economist at Nomura Securities stated, “Japan’s economy is expected to keep expanding through the first half of next year [meaning 2018].” A separate report confirmed confidence among Japan’s biggest manufacturers is also at an 11-year high.
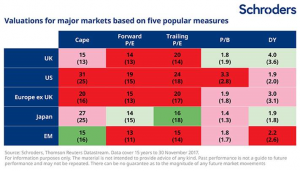
Finally: The year 2017 was a banner year in the financial markets. Major indexes in the U.S. hit a number of record highs, and there was not a single down month the entire year for the S&P 500 Total Return Index. The gains, however, have caused equity valuations to be stretched by almost all traditional metrics. By most measures, the US equity market is at its most overbought level in over 20 years. Duncan Lamont, head of research and analytics at Schroders Investment Management, writes that there is still some value in the market, “but it is hard work finding it.” In the following chart from Schroders, Dividend Yield is the only metric where the S&P 500 might be attractively valued compared to its 15-year average value (shown in parentheses). However, the reading of most concern is the CAPE, or cyclically-adjusted price-to-earnings multiple. The CAPE compares the S&P to its average, annual inflation-adjusted earnings over the previous 10 years. The current CAPE reading of 31 is above the 15-year average of 25, and nearly twice the long-term average of 16.8 that goes back to 1881. The only other times it has been above 30 were in 1929, before the Great Depression, and from 1997-2002, at the apex of the dot.com bubble. Some analysts say “It’s different this time”, citing rising profits from the new tax laws and differing accounting standards now vs then. Nonetheless, whenever one hears “It’s different this time” usually turns out to be a good time to look around the room for a door marked “Exit”! In this chart, Cape = CAPE, P/E = price to earnings, P/B = price to book value, DY = dividend yield and EM = Emerging Markets.
(sources: all index return data from Yahoo Finance; Reuters, Barron’s, Wall St Journal, Bloomberg.com, ft.com, guggenheimpartners.com, zerohedge.com, ritholtz.com, markit.com, financialpost.com, Eurostat, Statistics Canada, Yahoo! Finance, stocksandnews.com, marketwatch.com, wantchinatimes.com, BBC, 361capital.com, pensionpartners.com, cnbc.com, FactSet)
Indices mentioned are unmanaged and cannot be invested into directly. Past performance is no guarantee of future results. All Investing involves risk. Depending on the types of investments, there may be varying degrees of risk. Investors should be prepared to bear loss, including total loss of principal.