
1-13-2020 Weekly Market Update
The very Big Picture:
The long-term valuation of the market is commonly measured by the Cyclically Adjusted Price to Earnings ratio, or “CAPE”, which smooths out shorter-term earnings swings in order to get a longer-term assessment of market valuation. A CAPE level of 30 is considered to be the upper end of the normal range, and the level at which further PE-ratio expansion comes to a halt (meaning that increases in market prices only occur in a general response to earnings increases, instead of rising “just because”). The market is currently at that level.
Of course, a “mania” could come along and drive prices higher – much higher, even – and for some years to come. Manias occur when valuation no longer seems to matter, and caution is thrown completely to the wind as buyers rush in to buy first and ask questions later. Two manias in the last century – the 1920’s “Roaring Twenties” and the 1990’s “Tech Bubble” – show that the sky is the limit when common sense is overcome by a blind desire to buy. But, of course, the piper must be paid and the following decade or two are spent in Secular Bear Markets, giving most or all of the mania gains back.
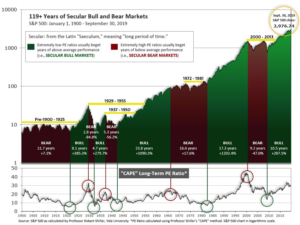
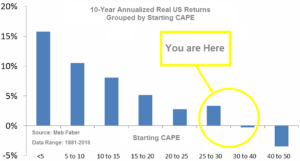
See Fig. 1 for the 100-year view of Secular Bulls and Bears. The CAPE is now at 31.31, up from the prior week’s 31.02, above the level reached at the pre-crash high in October, 2007. Since 1881, the average annual return for all ten year periods that began with a CAPE around this level have been in the 0% – 3%/yr. range. (see Fig. 2).
In the Big Picture:
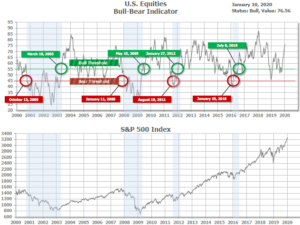
The “big picture” is the months-to-years timeframe – the timeframe in which Cyclical Bulls and Bears operate. The U.S. Bull-Bear Indicator (see Fig. 3) is in Cyclical Bull territory at 76.56, up from the prior week’s 75.04.
In the Intermediate and Shorter-term Picture:
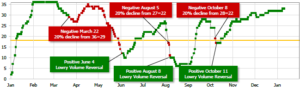
The Shorter-term (weeks to months) Indicator (see Fig. 4) is positive. The indicator ended the week at 33, up 1 from the prior week’s 32. Separately, the Intermediate-term Quarterly Trend Indicator – based on domestic and international stock trend status at the start of each quarter – was positive entering January, indicating positive prospects for equities in the first quarter of 2020.
Timeframe Summary:
In the Secular (years to decades) timeframe (Figs. 1 & 2), the long-term valuation of the market is historically too high to sustain rip-roaring multi-year returns. The Bull-Bear Indicator (months to years) remains positive (Fig. 3), indicating a potential uptrend in the longer timeframe. In the intermediate timeframe, the Quarterly Trend Indicator (months to quarters) is positive for Q1, and the shorter (weeks to months) timeframe (Fig. 4) is positive. Therefore, with three indicators positive and none negative, the U.S. equity markets are rated as Positive.
In the Markets:
U.S. Markets: U.S. stocks hit new record highs as the prospects for a wider armed conflict between the U.S. and Iran faded by the end of the week. Technology stocks outperformed as bellwether Apple reported stronger-than-expected iPhone sales in China. The tech-heavy NASDAQ Composite rose for a fifth consecutive week, adding 1.8%, while the large cap S&P 500 gained half that at 0.9%. The Dow Jones Industrial Average rose 189 points ending the week at 28,823—a gain of 0.7%. Smaller cap benchmarks finished the week in the red with both the S&P 400 mid cap index and Russell 2000 small cap index giving up -0.2%.
International Markets: Canada’s TSX rose 1.0%, while the United Kingdom’s FTSE gave up -0.5%. Markets on Europe’s mainland were mixed. France’s CAC 40 retreated -0.1%, while Germany’s DAX jumped 2.0%. In Asia, China’s Shanghai Composite rose 0.3% and Japan’s Nikkei gained 0.8%. As grouped by Morgan Stanley Capital International, developed markets rose 0.3% and emerging markets gained 1.5%.
Commodities: Precious metals finished the week mixed. Gold added 0.5% to end the week at $1560.10 an ounce, but Silver gave up -0.3% to close at $18.10 an ounce. After five consecutive weeks of gains, oil finished the week down a sizeable -6.4% to $59.04 per barrel for West Texas Intermediate crude. The industrial metal copper, viewed by some analysts as a barometer of world economic health due to its variety of uses, retraced most of last week’s decline by rising 1.0%.
U.S. Economic News: The jobs market ended 2019 on a sour note as December’s payroll and wage growth both missed expectations. The Labor Department’s Non-Farm Payrolls report (NFP) showed nonfarm payrolls increased by just 145,000. Economists had expected a reading of 160,000. Furthermore, average hourly earnings rose by just 2.9%, missing the 3.1% projection. December marked the first time that wage gains were below 3% on an annualized basis since July of 2018. The unemployment rate remained at 3.5% – a 50-year low. In the details, services payrolls rose 140,000 led by retail trade (+41k), leisure and hospitality (+40k), and health care (+28k). Goods-producing payrolls edged down 1,000, as a 20,000 job increase in construction was completely offset by declines in manufacturing (-12K) and mining-and-logging (-9K). Following the release, analysts noted the report was consistent with policy makers’ expectations and expect no change in monetary policy. A bright spot in an otherwise lackluster report was the broader measure of unemployment, known as the U6 component of the NFP report. The U6 measures not only unemployed but also marginally employed and involuntarily part time workers. It came in at a new record low of 6.7%, beating the previous low of 6.8% set back in October of 2000.
The number of Americans seeking first-time unemployment benefits fell for a fourth week in a row as new jobless claims fall back to a near 50-year low. The Labor Department reported initial jobless claims declined by 9,000 last week to 214,000. The reading was below economists’ forecasts of 220,000. The less-volatile monthly average of new claims dropped by 9,500 to 224,000. Overall, the trend appears to have flattened since the spring of 2019 and remains close to its lowest level since 1973.
In contrast to the NFP report, payroll-processor ADP reported that the private sector added the most jobs in over half a year. ADP reported private payrolls increased 202,000 in December. Analysts had expected an increase of just 150,000. Despite the strong performance at the end of the year, hiring moderated over the course of the year. Private payrolls increased an average of 163,000 per month in 2019—down from 219,000 in the previous year. In the report, services payrolls increased 173,000 led by a jump of 78,000 in the trade/transportation/utilities category. Goods-producing payrolls rose by 29,000—all of it in construction. Payroll gains were concentrated in small and medium-sized firms, which together accounted for ¾ of the total increase.
The services side of the economy, responsible for roughly 80% of the overall U.S. economy, rose to a four-month high at the end of 2019, the Institute for Supply Management (ISM) reported. ISM stated its nonmanufacturing index rose 1.1 point to 55 in December. Economists had expected a reading of 54.3. Readings over 50 indicate growth, while readings at 55 or above are considered exceptional. Anthony Nieves, chairman of the services survey stated, “The respondents are positive about the potential resolution on tariffs.” In the details, the increase was led by a 5.6 point jump in business activity to 57.2—its best level since August. Furthermore, 11 of the 17 industries tracked by ISM said their businesses were expanding. In a related survey, analytics firm Markit reported its U.S. services Purchasing Managers’ Index (PMI) also rose in December. That index also hit a five-month high, lifted by new orders and employment growth.
International Economic News: Despite geopolitical uncertainties, top economists are not expecting a recession in Canada this year. Brett House, Vice President and Deputy Chief Economist at Scotiabank, predicted “mediocre” growth for the country this year, writing “Going into 2020, we think it’s going to be another year where the Canadian economy performs in kind of a ‘meh’ sort of way.” Despite the unenthusiastic quote, House points out that although there is a lot of uncertainty, “we also have a lot of fundamental strengths that should keep growth going.” Avery Shenfeld, managing director and chief economist at CIBC Capital Markets, said he expects the Canadian equity market to slightly edge ahead of one of its biggest competitors. “We’ve gotten used to the fact that the Canadian equity market kind of trails the U.S. equity market year after year, but…this might be the year that they nudge their nose above the S&P 500 in terms of performance,” he said.
The chances of a rate cut in the United Kingdom rose this week after Bank of England policymaker Silvana Tenreyro said she would support the move if the economy slowed. Tenreyro said the bank’s November forecast for a recovery in demand assumed that the UK moved to a free trade agreement with the EU this year and that the recent uncertainty unwound quickly. “The risks to these assumptions are largely to the downside,” Ms. Tenreyro said. “If uncertainty around the future trade arrangement or subdued global growth continued to weigh on UK demand then my inclination is to respond with a vote for a cut in rates in the near term.” Her comments came a day after Bank of England governor Mark Carney stated that evidence of persistent weakness in activity would favor a “relatively prompt response”.
As crippling transportation strikes enter their sixth week in France, French Prime Minister Edouard Philippe offered a major concession to unions contesting his government’s overhaul of the pension system. Philippe said in a letter to unions and employers that he was prepared to withdraw plans to raise the retirement age for full pension benefits by two years to 64 if certain conditions were met. He made the concession after talks between the government and trade unions to break the deadlock failed this week. The CFDT union, France’s biggest welcomed the move, saying in a statement that it showed “the government’s will to find a compromise”.
Europe’s economic powerhouse Germany fell further into the doldrums as exports experienced a sharp drop at the end of the year. Exports fell -2.3% in November, much larger than expected. The drop narrowed Germany’s trade balance for the period to 18.2 billion euros, down from 21.3 billion euros, according to the Federal Statistics Agency. Furthermore, data for new manufacturing orders showed a -1.3% decline in November compared to the previous month. Expectations had been for a rebound in demand. Analysts don’t expect improvement anytime soon. Andrew Kenningham at Capital Economics stated, “We expect industrial output to decline in the first two quarters of this year too.”
China will reach its target of economic growth of 6% to 6.5% in 2020, said Ning Jizhe, head of China’s National Bureau of Statistics. Furthermore, he stated China remains the world’s fastest growing economy larger than $10 trillion. The remarks came as China and the U.S. agreed to a phase-one trade deal that brightens the outlook for the global economy in 2020. The White House is expected to publish details of the deal that cuts the import tariffs from 15% to 7.5% on more than $100bn of Chinese imports as soon as the agreement is implemented. In response, China has reportedly agreed to spend $200 billion a year on U.S. products.
A key economic index in Japan fell to a 6-year low as production remained weak. The Cabinet Office’s coincident index of business conditions edged down -0.2 point to 95.1—its worst level since February 2013. The office maintained its assessment that the world’s third-largest economy is “worsening,” using that most pessimistic expression for the fourth consecutive month. Production of chip-making equipment, lithium ion batteries and telecommunication devices were sluggish in particular, a government official said. Looking forward, the office said the index of leading indicators, predicting trends in the coming months, dropped 0.7 point to 90.9 in November, down for the fourth straight month.
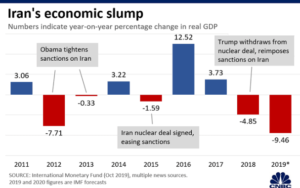
Finally: Following America’s killing of top Iranian general Qasem Soleimani in an airstrike, Iran responded with a missile barrage on U.S. interests in Iraq. Some feared war was inevitable, and Google searches for “World War III” spiked. However, officials from both countries have insisted they’re not interested in seeking an all-out war. Despite the humanitarian costs a war would bring to both countries, economists have pointed out the main reason Iran isn’t interested in a conflict is simple: it can’t afford it. With inflation running at more than 30%, curtailed oil exports, and a dramatically shrinking GDP (see chart below from cnbc.com), Iran is in no position to take on the financial burden of a war with the US or any other major power.
(Sources: all index return data from Yahoo Finance; Reuters, Barron’s, Wall St Journal, Bloomberg.com, ft.com, guggenheimpartners.com, zerohedge.com, ritholtz.com, markit.com, financialpost.com, Eurostat, Statistics Canada, Yahoo! Finance, stocksandnews.com, marketwatch.com, wantchinatimes.com, BBC, 361capital.com, pensionpartners.com, cnbc.com, FactSet) Securities offered through Registered Representatives of Cambridge Investment Research Inc., a broker-dealer, member FINRA/SIPC. Advisory Services offered through Cambridge Investment Research Advisors, a Registered Investment Adviser. Strategic Investment Partners and Cambridge are not affiliated.
Indices mentioned are unmanaged and cannot be invested into directly. Past performance is no guarantee of future results. All Investing involves risk. Depending on the types of investments, there may be varying degrees of risk. Investors should be prepared to bear loss, including total loss of principal.