
1-3-2022 Weekly Market Update
The very Big Picture
The long-term valuation of the market is commonly measured by the Cyclically Adjusted Price to Earnings ratio, or “CAPE”, which smooths-out shorter-term earnings swings in order to get a longer-term assessment of market valuation. A CAPE level of 30 is considered to be the upper end of the normal range, and the level at which further PE-ratio expansion comes to a halt (meaning that further increases in market prices only occur as a general response to earnings increases, instead of rising “just because”). The market is now above at that level.
Of course, a “mania” could come along and drive prices higher – much higher, even – and for some years to come. Manias occur when valuation no longer seems to matter, and caution is thrown completely to the wind – as buyers rush in to buy first, and ask questions later. Two manias in the last century – the “Roaring Twenties” of the 1920s, and the “Tech Bubble” of the late 1990s – show that the sky is the limit when common sense is overcome by a blind desire to buy. But, of course, the piper must be paid, and the following decade or two were spent in Secular Bear Markets, giving most or all of the mania-gains back.
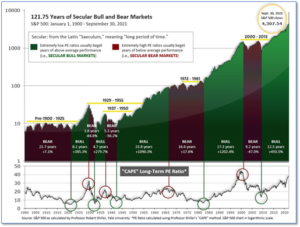
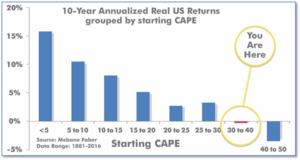
See Fig. 1 for the 100-year view of Secular Bulls and Bears. The CAPE is now at 39.98, up from the prior week’s 39.65. Since 1881, the average annual return for all ten-year periods that began with a CAPE in this range has been negative (see Fig. 2).
Note: We do not use CAPE as an official input into our methods. However, if history is any guide – and history is typically ‘some’ kind of guide – it’s always good to simply know where we are on the historic continuum, where that may lead, and what sort of expectations one may wish to hold in order to craft an investment strategy that works in any market ‘season’ … whether the current one, or one that may be ‘coming soon’!
The Big Picture:
The ‘big picture’ is the (typically) years-long timeframe – the timeframe in which Cyclical Bulls and Bears operate. The U.S. Bull-Bear Indicator is in Cyclical Bull territory at 61.31, up from the prior week’s 60.31.

In the Quarterly- and Shorter-term Pictures
The Quarterly-Trend Indicator based on the combination of U.S. and International Equities trend-statuses at the start of each quarter – was Positive entering October, indicating positive prospects for equities in the fourth quarter of 2021.
Next, the short-term(weeks to months) Indicator for US Equities turned positive on December 7 and ended the week at 20, up from the prior week’s 8.

In the Markets:
U.S. Markets: Most of the major U.S. indexes recorded gains for the week, as a “Santa Claus rally” lifted the S&P 500 index to record highs. The Dow Jones Industrial Average rose 388 points in the last week of 2021 finishing the year at 36,388—a gain of 1.1%. The technology-heavy NASDAQ Composite lagged and ticked down -0.1% to 15,645. By market cap, the large cap S&P 500 rose 0.9%, the mid cap S&P 400 added 1.7%, and the small cap Russell 2000 gained 0.2%.
International Markets: Major international markets had a relatively quiet week of trading. Canada’s TSX finished the week unchanged, while the United Kingdom’s FTSE rose 0.2%. France’s CAC 40 rose 0.7% and Germany’s DAX finished up 0.8%. In Asia, China’s Shanghai Composite ticked down -0.01%. Japan’s Nikkei finished flat. As grouped by Morgan Stanley Capital International, developed markets finished the week up 0.4% and emerging markets gained 0.3%.
Commodities: Commodities finished the week solidly to the upside. Gold rose 0.9% to $1828.60 per ounce, while Silver gained 1.8% and closed at $23.35. Crude oil rose for a second week. West Texas Intermediate crude oil added 1.9% finishing at $75.21 per barrel. The industrial metal copper, seen by some analysts as a barometer of global economic health due to its wide variety of uses, closed up 1.6%.
Q4 and 2021 Summary:
U.S: In the last quarter of 2021, the Dow and the NASDAQ rose 7.4% and 8.3%, respectively, while the large cap S&P 500 gained 10.6%. Mid caps finished the quarter up 7.6%. Small caps rose just 1.9%. For the entire year, the S&P led the way with a 26.9% gain, followed by mid caps, up 23.2%, and the NASDAQ, up 21.4%. The Dow added over 5700 points last year—a gain of 18.7%. Small caps lagged the field, and finished the year up 13.7%.
International: In the final quarter of the year, Canada and the UK rose 5.7% and 4.2%, respectively, while France rose 9.7% and Germany gained 4.1%. China added 2% while Japan pulled back -2.2%. Emerging markets declined -1.6% while developed markets gained 2.8%. For 2021, France rose 28.9%, followed by Canada, up 21.7%, and Germany up 15.8%. The UK gained 14.3%. China and Japan had a rather lackluster year, rising 4.8% and 4.9%, respectively. Developed markets finished the year up 11.4%, but emerging markets declined -3.6%.
Commodities: In the fourth quarter, Gold and Silver rose 4.1% and 5.9%, while oil ticked up 0.2%. Copper surged 9.2%. For the year, Gold pulled back -3.5% and Silver declined -11.6%. Copper jumped 26.8%, while oil was the big commodity winner, surging 55.1%.
U.S. Economic News: The number of people filing new unemployment claims declined last week, remaining near 52‑year lows. The Labor Department reported 198,000 people applied for first-time unemployment benefits last week. Economists had expected a reading of 205,000. The extremely low number of people applying reflects the reluctance of businesses to lay off workers when qualified labor is so hard to obtain. New filings rose the most in New Jersey, Pennsylvania, Michigan and Ohio. Claims fell the most in California, Texas, and Virginia. Meanwhile, continuing jobless claims, which is the number of people already receiving benefits, dropped by 140,000 to 1.72 million. That number has now returned to pre-crisis levels.
For the third consecutive month, the rate of home-price appreciation slowed according to the latest report from Standard & Poors. The S&P CoreLogic Case-Shiller 20-city price index, which covers 20 major metropolitan areas in the U.S., posted an 18.4% year-over-year gain in October. While impressive, the reading was down from 19.1% the previous month. On a monthly basis, the index increased 0.8% between September and October. More broadly, the Case-Shiller national home price index showed a 19.1% annual gain. This was down 0.6% from its previous reading. Still, the reading represented the fourth-largest annual increase in home prices over the 34-year history of the data. Phoenix once again led the country in terms of home-price growth, with a 32.3% increase, followed by two Florida cities, Tampa and Miami. Economists don’t expect this level of price appreciation to continue. CoreLogic Deputy Chief Economist Selma Hepp wrote, “Unfortunately, the rate of home-price growth will be limiting for many young buyers who have yet to accumulate sufficient equity gains, and an expected increase in mortgage rates next year will present further challenges. Together, these two factors will keep a lid on continued home-price acceleration.”
In fact, these factors may already be weighing on the sentiment of home buyers. The National Association of Realtors (NAR) reported pending home sales, in which a contract has been signed to purchase a home but the deal has not yet closed, decreased 2.2% in November compared with October. Economists had expected a 0.8% increase. Compared to the same time last year, pending sales were down 2.7%. By region, every region reported a drop in signings. The Midwest logged the largest decrease with a -6.3% decline. Lawrence Yun, chief economist at the NAR wrote, “There was less pending home sales action this time around, which I would ascribe to low housing supply, but also to buyers being hesitant about home prices.” Danielle Hale, chief economist at Realtor.com, felt the decline was due primarily to seasonal factors, saying sellers were likely waiting until spring to list homes for sale.
In the greater Chicago-region, economic activity grew a bit faster in December, despite the spread of the latest ‘Omicron’ variant of the coronavirus. The Chicago Business Barometer, also known as the Chicago PMI, rose to 63.1 in December from 61.8 in November. Economists had forecast a reading of 62. The latest reading shows the region’s economy remains robust. While readings above 50 signal growth, analysts consider readings above 60 exceptional. Analysts view the Chicago Business Barometer as a good indicator of the state of manufacturing and the broader U.S. economy. The one negative in the report: employment fell again to its lowest level since June, reflecting the ongoing labor shortage in the U.S. “Firms stated that finding new hires to fill empty positions is challenging,” the report said.
International Economic News: Statistics Canada (StatCan) reported real gross domestic product increased by 0.8% in October. Gains for the month were seen across most sectors, including manufacturing where a robust 1.8% rebound more than made up for September’s contraction. StatCan stated total economic activity now sits just 0.4% below pre-pandemic levels recorded in February 2020. Furthermore, preliminary data shows data for November suggests a further rise in GDP of 0.3% for that month.
Across the Atlantic, Britain’s economy is set to outpace every other nation in the G7 next year according to analysts at the International Monetary Fund (IMF). The IMF reported Britain’s economy is expected to grow 5% in 2022, higher than the 4.9% expected for the global economy. In addition, Goldman Sachs economists forecast the U.K. economy will jump 4.8% next year. That reading easily trumps the 3.5% predicted for the U.S., 4.0% for Germany, and 4.4% for France and Italy. Britain formally left the EU on January 1, 2021 and, since then, output has surged by almost 7% as the country battled back from a deep recession.
On Europe’s mainland, French President Emmanuel Macron warned the French people of tough days ahead amid a spike in coronavirus infections and pledged to continue helping businesses affected by the pandemic. “The coming weeks will be difficult, we all know that,” Macron said in his New Year’s national address from the Elysee Palace in Paris. The coronavirus surge, with a daily record of 232,200 new infections reported this week, has become a challenge for Macron four months before the presidential election. He cited cultural venues, tourism and sports as sectors facing the “economic consequences” of the virus resurgence. “We will help them as we must do and as we have been doing since the beginning of the pandemic,” Macron said.
With energy prices already on the rise and increased tensions between Europe and its key gas supplier Russia, Germany made the controversial “green” decision to shut down three of its nuclear power plants this week. The closure of the plants in Brokdorf, Grohnde, and Gundremmingen, will cut in half Germany’s nuclear power capacity and reduce its energy output by around four gigawatts—equivalent to the power produced by 1,000 wind turbines. Germany is planning to completely wind down atomic energy by the end of 2022, when it will shut its final three plants in Neckarwestheim, Essenbach and Emsland. Europe’s reference gas price, Dutch TTF, hit 187.78 euros per megawatt hour in December–10 times higher than at the start of the year.
In Asia, top leaders in Beijing warned at an economic planning meeting this month that China’s economy faces a “triple threat” heading into the new year: shrinking demand, supply shocks, and weakening consumer spending. “The core problem of these ‘triple pressures’ is still a weakening of demand or insufficient demand,” Wang Jun, chief economist at Zhongyuan Bank, said. “If demand improves, then expectations will improve.” Sluggish consumer spending has dragged down China’s economy since the pandemic. Along with the property market, consumption is one of the two areas economists are most concerned about. “How consumption recovers next year will have a very great impact on the economy,” Jianguang Shen, chief economist at Chinese e-commerce company JD.com said.
The Japanese economy is expected to accelerate its expansion in 2022, following the sharp turnaround at the end of 2021. Analysts predict the world’s third-largest economy will see 2-4% growth in fiscal 2022 (starting in April). After the economy shrank a record 4.5% in 2020 with the coronavirus outbreak, it began to pick up in the fall of 2021 as vaccinations progressed and economic restrictions were lifted. The government predicts a 2.6% growth in 2021, followed by a 3.2% increase in 2022. Economists say strong growth is expected especially in the first half of 2022, thanks to restaurants and bars and other hospitality businesses returning to normal operations and the government’s stimulus initiatives, including the “Go To Travel” domestic tourism subsidy program which is expected to resume around February.
Finally: Ever heard of “Click & Collect”? Visit your local Walmart on any given day and you’ll likely see a row of minivans and sedans with trunks open lining the side of the store and workers loading bins into them. Initially developed by supermarket chains, this so-called “Click & Collect” service made it possible for consumers to buy online and then conveniently collect their purchases at the nearest store location. Walmart embraced this business model wholeheartedly, and overtook the grocery stores to become by far the biggest click & collect retailer in the country. Data from Insider Intelligence shows Walmart scored 25.4% of all click & collect orders in 2021—which translates to an estimated $20.4 billion in sales. After Walmart, Home Depot is expected to have the second-largest market share for click and collect in 2021, accounting for an estimated 13.3% of all sales through the channel. Furthermore, Insider Intelligence expects click & collect sales to jump by 21% to $101 billion in 2022. (Chart from cnbc.com)

(Sources: All index- and returns-data from Yahoo Finance; news from Reuters, Barron’s, Wall St. Journal, Bloomberg.com, ft.com, guggenheimpartners.com, zerohedge.com, ritholtz.com, markit.com, financialpost.com, Eurostat, Statistics Canada, Yahoo! Finance, stocksandnews.com, marketwatch.com, wantchinatimes.com, BBC, 361capital.com, pensionpartners.com, cnbc.com, FactSet.) Securities offered through Registered Representatives of Cambridge Investment Research Inc., a broker-dealer, member FINRA/SIPC. Advisory Services offered through Cambridge Investment Research Advisors, a Registered Investment Adviser. Strategic Investment Partners and Cambridge are not affiliated. Indices mentioned are unmanaged and cannot be invested into directly. Past performance is no guarantee of future results.