
12-27-2021 Weekly Market Update
The very Big Picture
The long-term valuation of the market is commonly measured by the Cyclically Adjusted Price to Earnings ratio, or “CAPE”, which smooths-out shorter-term earnings swings in order to get a longer-term assessment of market valuation. A CAPE level of 30 is considered to be the upper end of the normal range, and the level at which further PE-ratio expansion comes to a halt (meaning that further increases in market prices only occur as a general response to earnings increases, instead of rising “just because”). The market is now above at that level.
Of course, a “mania” could come along and drive prices higher – much higher, even – and for some years to come. Manias occur when valuation no longer seems to matter, and caution is thrown completely to the wind – as buyers rush in to buy first, and ask questions later. Two manias in the last century – the “Roaring Twenties” of the 1920s, and the “Tech Bubble” of the late 1990s – show that the sky is the limit when common sense is overcome by a blind desire to buy. But, of course, the piper must be paid, and the following decade or two were spent in Secular Bear Markets, giving most or all of the mania-gains back.
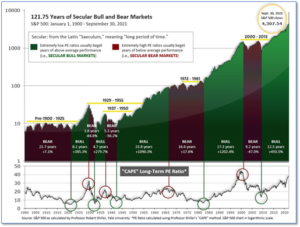
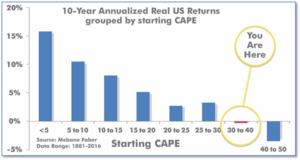
See Fig. 1 for the 100-year view of Secular Bulls and Bears. The CAPE is now at 39.65, up from the prior week’s 38.76. Since 1881, the average annual return for all ten-year periods that began with a CAPE in this range has been negative (see Fig. 2).
Note: We do not use CAPE as an official input into our methods. However, if history is any guide – and history is typically ‘some’ kind of guide – it’s always good to simply know where we are on the historic continuum, where that may lead, and what sort of expectations one may wish to hold in order to craft an investment strategy that works in any market ‘season’ … whether the current one, or one that may be ‘coming soon’!
The Big Picture:
The ‘big picture’ is the (typically) years-long timeframe – the timeframe in which Cyclical Bulls and Bears operate. The U.S. Bull-Bear Indicator is in Cyclical Bull territory at 60.31, up from the prior week’s 59.74.

In the Quarterly- and Shorter-term Pictures
The Quarterly-Trend Indicator based on the combination of U.S. and International Equities trend-statuses at the start of each quarter – was Positive entering October, indicating positive prospects for equities in the fourth quarter of 2021.
Next, the short-term(weeks to months) Indicator for US Equities turned positive on December 7 and ended the week at 8, up from the prior week’s 7.

In the Markets:
U.S. Markets: U.S. stocks rebounded from the losses of the previous on signs that the Omicron variant of the coronavirus may not be as disruptive as feared. Trading volumes were low ahead of the Christmas holiday. The Dow Jones Industrial Average surged 585 points finishing the week at 35,950—a gain of 1.7%. The technology-heavy NASDAQ Composite retraced all of last week’s decline and then some by rising 3.2% to 15,653. By market cap, the large cap S&P 500 rose 2.3%, while the mid-cap S&P 400 added 2.5%. The small cap Russell 2000 finished the week up 3.1%.
International Markets: Major international markets also finished predominantly in the green. Canada’s TSX rose 2.3% and the United Kingdom’s FTSE 100 gained 1.4%. On Europe’s mainland, France’s CAC 40 and Germany’s DAX added 2.3% and 1.4%, respectively. In Asia, China’s Shanghai Composite ticked down -0.4%. Japan’s Nikkei notched a third week of gains, finishing the week up 0.8%. As grouped by Morgan Stanley Capital International, developed markets rallied 2.4%, while emerging markets gained 1.2%.
Commodities: Precious metals rose alongside the equities markets. Gold rose 0.4% to $1811.70 per ounce, while silver gained 1.8% to $22.94. Energy rebounded after last week’s decline. West Texas Intermediate crude oil finished the week up 4.3% to $73.79 per barrel. The industrial metal copper, viewed by some analysts as a barometer of world economic health due to its wide variety of uses, added 2.3% last week.
U.S. Economic News: The number of Americans filing first-time unemployment claims remained unchanged last week at 205,000. Before the pandemic, initial claims had averaged about 220,000 a week. The number of people already collecting benefits, known as continuing claims, declined slightly to 1.86 million. The low number of claims reflects the tight labor market and robust demand for workers. Economists expect claims to gradually rise toward their pre-pandemic level of around 1.7 million as more individuals return to the labor market as their benefits expire.
Sales of existing homes rose to their highest levels in almost a year in November according to the latest data from the National Association of Realtors (NAR). The NAR reported existing home sales rose 1.9% to a seasonally-adjusted annual rate of 6.46 million last month—its third consecutive monthly gain and the highest level since January. Compared to the same time in 2020, home sales were down 2%. The reading was a slight miss from the 6.5 million annual rate economists had expected. On a regional basis, the southern states are seeing the most gains. Sales rose 2.9% in the South, and 2.3% in the West. Sales were up a slight 0.7% in the Midwest and were unchanged in the East. The median price for an existing home sold in November was $353,900, an increase of 13.9% over the past year. Unsold inventory was at a 2.1 month supply–the lowest since January. A six-month supply is generally considered a “balanced” housing market.
New home sales jumped 12.4% to a seasonally-adjusted annual rate (SAAR) of 744,000 last month the government reported. Despite the increase, sales were below expectations. Analysts had expected a SAAR of 766,000. Of note, the median sales price of a new home sold was $416,900—a new record high. The supply of new homes fell slightly to a 6 ½ month supply. Regionally, sales rose in all regions in November except the Midwest. Sales were strongest in the West. The housing sector remains robust but remains off the highs seen last year. Sales are currently 14% below last year’s level. Although the sector is expected to continue to be strong, the prospect of higher mortgage rates should keep activity from getting red-hot again, economists said.
The confidence of the nation’s consumers showed resilience this month in the face of rising prices for just about everything. The Conference Board reported its index of consumer confidence rose to 115.8 in December from a revised 111.9 in the prior month. Economists were expecting a reading of just 111. Confidence in November was revised to a modest gain after initial estimates of a sharp decline. The part of the survey that tracks how consumers feel about current economic conditions fell 0.3 point to 144.1 this month, while the gauge that assesses what Americans expect over the coming six months rose to 96.9 from 90.2. Lynn Franco, senior director of economic indicators at the Conference Board stated, “Expectations about short-term growth prospects improved, setting the stage for continued growth in early 2022. The proportion of consumers planning to purchase homes, automobiles, major appliances, and vacations over the next six months all increased.”
The Conference Board reported its index of leading economic indicators (LEI) rose a sharp 1.1% last month, exceeding forecasts of a 0.9% gain. Over the last six months, the index is up 4.6%. The increase signals the economy should continue to expand in the first half of 2022—although the emergence of a new COVID-19 variant along with persistent inflation and risks to the supply chain remain. Eight out of 10 LEI subcomponents increased in November, led by jobless claims, equity prices and the Treasury yield curve. The coincident index, which measures current conditions, rose 0.3% in November after a 0.5% gain in the prior month, while the lagging index fell 0.1%. The LEI is a weighted gauge of 10 indicators designed to signal business-cycle peaks and valleys.
The mood of America’s consumers continued to show gradual improvement according to the University of Michigan. The gauge of consumer sentiment rose 3.2 points to 70.6 in December. The reading was slightly above the consensus forecast of an unchanged reading of 70.4. Sentiment has remained relatively stable since it dipped sharply in August. Sentiment was as high as 88.3 in April. Richard Curtin, the UMich survey’s chief economist stated, “The uptick was primarily due to significant gains among households with incomes in the bottom third of the distribution. Indeed, the bottom third expected their incomes to rise during the year ahead by 2.8%, up from 1.8% last December.”
The 12-month increase in the Personal Consumption Expenditures (PCE) index, rumored to be the Federal Reserve’s preferred measure of inflation, jumped to 5.7% in November from 5% the prior month. That reading is the highest since 1982. The spike in inflation explains the Fed’s pivot earlier this month away from its dovish policy stance, analysts said. Economists don’t think inflation will peak for several more months. The core PCE rate that strips out food and energy surged to 4.7% from 4.1% on an annual basis. Meanwhile, consumer spending rose 0.6% in November following a 1.4% gain in the prior month. After adjusting for inflation, consumer spending was actually flat in November.
The Chicago Fed’s nationwide measure of the economy continued to grow in November, but at a slower pace. The Chicago Fed reported its National Activity Index (CFNAI) fell to 0.37 last month, from 0.75 the month before. The reading was close to economists’ expectations of a reading of 0.40. Three of the four broad categories of indicators used to construct the index made positive contributions to it in November, but all four categories worsened compared with October, the Chicago Fed said. The CFNAI index is composed of 85 economic indicators drawn from four broad categories of data. Both the index and its three-month average suggest that the U.S. economy continues to expand at a moderate pace.
International Economic News: The Canadian economy maintained its streak of monthly gains in October by adding 0.8% to GDP growth for the month. The reading brought it within a statistical inch of where it was before the coronavirus pandemic began. Statistics Canada reported total economic activity in October was just 0.4% below the pre-pandemic level recorded in February 2020. Furthermore, the gains are expected to continue. Preliminary data pointed to another gain in November that Statistics Canada said would leave the gap at just 0.1%. Gains for the month were seen across most sectors, including manufacturing, whose rebound of 1.8% was driven primarily by auto manufacturing.
Across the Atlantic, the United Kingdom’s economy grew more slowly in the third quarter than previously thought, and that was before the ‘Omicron’-variant of the coronavirus posed a further threat to the global recovery. The UK’s Office for National Statistics reported gross domestic product in the world’s fifth-biggest economy increased by 1.1% in the third quarter—weaker than the 1.3% preliminary estimate. Analysts also expect the data to show a further slowdown in the fourth quarter and a weak start to 2022 due to a rise in Omicron cases which weighed on Britain’s hospitality and leisure sector and retailers. Prime Minister Boris Johnson has ruled out new COVID restrictions in England before Christmas but said he might have to act afterwards.
On Europe’s mainland, in their first phone conversation new chancellor of Germany Olaf Scholz and Chinese President Xi Jinping pledged to strengthen economic ties. According to China’s state-run news agency Xinhua, the new German leader urged Xi that German-Chinese relations should be fostered “in the spirit of mutual respect and mutual trust.” Xi Jinping reiterated that China-Germany cooperation is the forerunner of China-EU cooperation, and that as the two countries look ahead to the next 50 years, they must have a global and long-term perspective, move forward, and strive for new developments in bilateral relations.
In Asia, China’s Ministry of Commerce has expressed “strong dissatisfaction and firm opposition” to a United States ban on imports from its Xinjiang region. The ministry described the US action as “economic bullying”, according to state news agency Xinhua. This week US President Joe Biden signed into law legislation that bans imports from China’s Xinjiang region over concerns about forced labor. China has categorically dismissed accusations of abuses against the mostly Muslim Uyghur minorities in that region. The law prohibits US businesses from importing goods from Xinjiang unless they can be proven not to have been made by forced labor.
The Japanese government lifted its growth forecast for 2022 a full percentage point as it expects the rate of recovery from the pandemic-related slump to pick up earlier than expected. The government now expects the economy to grow 3.2% next year. The GDP growth forecast for the next fiscal year is slightly higher than the average 3.0% increase estimated by private-sector economists in a survey earlier this month by the Japan Center for Economic Research. In nominal terms, unadjusted for inflation, the world’s third-largest economy will likely expand 3.6% to a record 564.6 trillion yen in fiscal 2022, upgraded from an earlier projection of 2.5%, the government said.
Finally: While most adult readers of an economic situation report such as this one would be forgiven for never having heard of a company named “Shein”, there’s a good chance the young women in their families have. The Chinese clothing retailer and manufacturer Shein has exploded in growth over the past year and half. Google data shows it surpassed other major online brands like H&M, Zara, and Asos. Shein specializes in what analysts call “fast fashion”—a term meaning designs from fashion shows and runways that it then makes available to the public almost instantly. Shein’s tight control of production and relatively small batch manufacturing of selected items tied with its super-low prices results in a powerful feedback loop with social media influencers. On a recent day, an astonishing 8,895 new products were added—and 9,634 were added the day before! (Chart from chartr.co)

(Sources: All index- and returns-data from Yahoo Finance; news from Reuters, Barron’s, Wall St. Journal, Bloomberg.com, ft.com, guggenheimpartners.com, zerohedge.com, ritholtz.com, markit.com, financialpost.com, Eurostat, Statistics Canada, Yahoo! Finance, stocksandnews.com, marketwatch.com, wantchinatimes.com, BBC, 361capital.com, pensionpartners.com, cnbc.com, FactSet.) Securities offered through Registered Representatives of Cambridge Investment Research Inc., a broker-dealer, member FINRA/SIPC. Advisory Services offered through Cambridge Investment Research Advisors, a Registered Investment Adviser. Strategic Investment Partners and Cambridge are not affiliated. Indices mentioned are unmanaged and cannot be invested into directly. Past performance is no guarantee of future results.