1-10-2022 Weekly Market Update
The very Big Picture
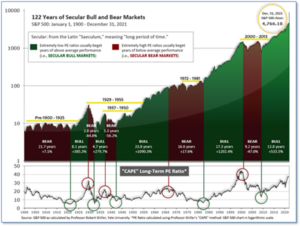
The long-term valuation of the market is commonly measured by the Cyclically Adjusted Price to Earnings ratio, or “CAPE”, which smooths-out shorter-term earnings swings in order to get a longer-term assessment of market valuation. A CAPE level of 30 is considered to be the upper end of the normal range, and the level at which further PE-ratio expansion comes to a halt (meaning that further increases in market prices only occur as a general response to earnings increases, instead of rising “just because”). The market is now above at that level.
Of course, a “mania” could come along and drive prices higher – much higher, even – and for some years to come. Manias occur when valuation no longer seems to matter, and caution is thrown completely to the wind – as buyers rush in to buy first, and ask questions later. Two manias in the last century – the “Roaring Twenties” of the 1920s, and the “Tech Bubble” of the late 1990s – show that the sky is the limit when common sense is overcome by a blind desire to buy. But, of course, the piper must be paid, and the following decade or two were spent in Secular Bear Markets, giving most or all of the mania-gains back.

See Fig. 1 for the 100-year view of Secular Bulls and Bears. The CAPE is now at 39.24, down from the prior week’s 39.98. Since 1881, the average annual return for all ten-year periods that began with a CAPE in this range has been negative (see Fig. 2).

Note: We do not use CAPE as an official input into our methods. However, if history is any guide – and history is typically ‘some’ kind of guide – it’s always good to simply know where we are on the historic continuum, where that may lead, and what sort of expectations one may wish to hold in order to craft an investment strategy that works in any market ‘season’ … whether the current one, or one that may be ‘coming soon’!
The Big Picture:
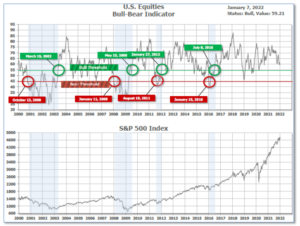
The ‘big picture’ is the (typically) years-long timeframe – the timeframe in which Cyclical Bulls and Bears operate. The U.S. Bull-Bear Indicator is in Cyclical Bull territory at 59.21, down from the prior week’s 61.31.

In the Quarterly- and Shorter-term Pictures
The Quarterly-Trend Indicator based on the combination of U.S. and International Equities trend-statuses at the start of each quarter – was Positive entering October, indicating positive prospects for equities in the fourth quarter of 2021.
Next, the short-term(weeks to months) Indicator for US Equities turned positive on December 7 and ended the week at 23, up from the prior week’s 20.

In the Markets:
U.S. Markets: U.S. stocks continued pulling away from their record highs as significantly higher interest rates took a toll on growth and technology stocks. The technology-heavy NASDAQ Composite shed over 700 points finishing the week at 14,936—a decline of -4.5%. The Dow Jones Industrial Average held up the best giving up just 0.3% and closing at 36,232. By market cap, the large cap S&P 500 closed down -1.9%, while the mid cap S&P 400 shed -1.7%. The small cap Russell 2000 ended the week down -2.9%.
International Markets: International markets finished the week mixed. Canada’s TSX declined -0.7% and the United Kingdom’s FTSE 100 rose 1.4%. On Europe’s mainland, France’s CAC 40 and Germany’s DAX rose 0.9% and 0.4%, respectively. In Asia, China’s Shanghai Composite declined -1.7% and Japan’s Nikkei fell -1.1%. As grouped by Morgan Stanley Capital International, developed markets and emerging markets each ticked up 0.1%.
Commodities: Precious metals finished the week in the red. Gold retreated -1.7% to $1797.40 an ounce, while Silver shed -4.0% and closed at $22.41. Energy rose for a third consecutive week. West Texas Intermediate crude oil gained 4.9% to close at $78.90 per barrel. Copper, viewed by some analysts as a barometer of world economic health due to its wide variety of industrial uses, finished the week down -1.2%.
U.S. Economic News: Applications for first-time unemployment benefits rose slightly last week to 207,000, the Labor Department reported. The reading remained near its more than 50-year low, suggesting that the soaring number of Omicron cases isn’t having much effect on layoffs. Economists had expected initial jobless claims to total 195,000. Some analysts note that the government’s method of adjusting jobless claims for seasonal swings can sometimes skew the readings too much, especially around the holiday season at the end of the year. The raw or actual number of jobless claims jumped by 315,469 last week, likely the result of people losing their temporary holiday jobs and possibly Omicron-related layoffs. Meanwhile, continuing claims, which counts the number of people already receiving benefits, increased by 36,000 to 1.75 million. That number is back to pre-pandemic levels.
The U.S. created just 199,000 new jobs in December, signaling that persistent labor shortages and the coronavirus variant continue to hold back the U.S. economy. The reading was well below Wall Street’s expectations for 422,000 new jobs. Also in the release, the Bureau of Labor Statistics reported the jobless rate slipped 0.3% to 3.9%–a new pandemic low. The rate stood at 3.5% right before the pandemic began. In another good sign, more people entered the labor force for the third month in a row. That kept the so-called labor-force participation rate at a pandemic high of 61.9%. Companies in the hospitality business such as restaurants and hotels led the way in hiring last month. They added 53,000 jobs. Professional businesses hired 43,000 people, manufacturers added 26,000 jobs, construction employment rose by 22,000 and transportation and warehouse firms beefed up payrolls by 19,000.
The number of Americans quitting their jobs surged by 370,000 to a record 4.5 million in November, the Labor Department reported. The reading pushed the so-called ‘quits rate’ to 3%–also matching a prior record high. While a higher ‘quits rate’ is generally regarded as positive for the economy, as it is assumed one would only quit a job in favor of a more lucrative one, analysts aren’t so sure this reading is a positive. Some analysts worry that the high quits rate may lead to higher wage inflation and cause the Federal Reserve to take more drastic action to cool the economy. Also in the report, job openings fell by 529,000 to 10.6 million at the end of November. Economists had forecast an increase of 500,000 to 11.1 million vacancies.
Manufacturing activity remained strong at the end of year, but was slightly weaker than initially reported. Analytics firm IHS Markit reported the final reading of its manufacturing Purchasing Managers Index (PMI) was adjusted downward to a reading of 57.7. Its reading for November was 58.3. Sian Jones, senior economist at IHS Markit, said material shortages and supplier delays dragged down the index. New orders rose at their slowest pace for the year. Of note, there was some relief on cost pressures. That sub-index rose at its slowest pace over the last six months.
The Institute for Supply Management (ISM) released a similar report regarding manufacturing. The ISM index of U.S.‑based manufacturers dropped 2.4 points to 58.7 in December. That reading was its lowest reading since January of last year. Economists had expected the index to slip only slightly to 60.0. As in Markit’s report, ISM reported its measure of inflation fell to its lowest level in 13 months. The prices index sank to 68.2 from 82.4. However, Tim Fiore, chairman of the survey remained cautious stating he expects prices to continue to rise until the middle of the year before reaching a top. “I don’t think prices have peaked yet,” he said.
At its last meeting in December, Federal Reserve officials seemed eager to convince the country that they have a plan for moving away from their current easy policy stance minutes showed. The summary stated, “Participants generally noted that, given their individual outlooks for the economy, the labor market, and inflation, it may become warranted to increase the federal funds rate sooner or at a faster pace than participants had earlier anticipated.” At the meeting, Fed officials had a wide-ranging discussion of how to move policy away from its current easy stance by hiking rates and also shrinking its $8.67 trillion balance sheet. After reading the minutes, Katherine Judge, economist at CIBC Securities, said she thinks the Fed will begin to shrink the balance sheet “relatively soon” after the first rate hike in the April-June quarter. The minutes show that “almost all” Fed officials revised up their forecast for inflation this year and “many” raised their forecast for 2023.
International Economic News: Economists expect the Canadian economy could hit a ‘two-month air pocket’ to start the year. This week, economists at the Economic Club of Canada’s Outlook 2022 event stated they expected a decline in the first quarter for Canada’s economy and for key interest rates to rise 75 basis points this year. Douglas Porter, managing director and chief economist for BMO Financial Group stated the new Omicron-variant “has thrown a huge curveball” at the economic outlook for the first quarter of 2022. Furthermore, Porter said, “We suspect that the economy will hit about a two-month air pocket due to new restrictions.”
Across the Atlantic, the British Chamber of Commerce said the results of a recent survey showed Britain’s economic recovery stalled before the arrival of the new Omicron-variant and that the British government’s “plan B” restrictions on consumer spending during the Christmas holiday weighed on sales. Businesses blamed spiraling inflation and shortages of imported goods for the decline in sales in the fourth quarter of last year. Suren Thiru, the BCC’s head of economics, said sales growth stalled as firms struggled with the “mounting headwinds” of inflation, a scarcity of skilled workers, and problems sourcing products from overseas.
On Europe’s mainland, French Finance Minister Bruno Le Maire said the country’s growth would be significantly higher this year than the government’s current forecast of 6.25%. Le Maire also said that even though the surge of the Omicron coronavirus variant was disrupting some sectors there was no risk of it paralyzing the economy. Le Maire’s forecast is at the low end of a range of official projections, with the Banque de France seeing the 2021 GDP at 6.7%, the IMF at 6.75% and the OECD at 6.8%.
Inflation in Germany rose to its highest level since 1993 according to the country’s national statistics agency. Germany’s Federal Statistics Office reported consumer prices soared by an average 3.1% in 2021 compared with 2020. The inflation rate shot up to 5.2% in November–a figure not seen since the early 1990s. The skyrocketing prices are blamed on the global increase in energy prices during 2021. Annual household energy prices in Germany surged by over 22% in the past year. ECB board member, Isabel Schnabel, said in a recent interview that inflation will stay at an elevated point for a chunk of the year, before declining as 2022 passes.
In Asia, the Center for Economics and Business Research (CEBR) reported China’s GDP is expected to grow 5.7% each year through 2025, and then 4.7% annually until 2030. Its forecast means China, now the world’s second-largest economy, would overtake the number one ranked United States by 2030. Chinese leaders have pushed over the past decade to rely more on value-added services over traditional factory exports, state media reports. China’s economy totaled $15.92 trillion in 2020, and market research firm IHS Markit estimates that it reached $18 trillion last year on export manufacturing growth and capital for new projects. The U.S. economy reached about $23 trillion last year, the market research firm said.
About 84% of major companies in Japan expect the country’s economy to grow in 2022, a Kyodo News survey showed. The overall percentage of firms forecasting growth in the world’s third-largest economy is up from the 74% in a similar poll conducted last year. Prime Minister Fumio Kishida has vowed to minimize the spread of the Omicron variant of the coronavirus while moving swiftly to get the economy back on track. Japan has not yet seen a sizable boost in economic activity compared with the United States and Europe, where so-called “revenge spending” is rather obvious.
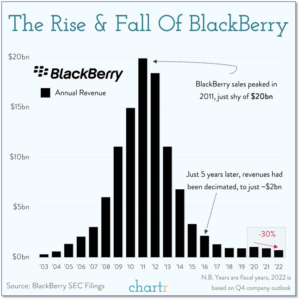
Finally: On January 4th, classic mobile phone manufacturer BlackBerry announced it will no longer support any of its phones, the last of which were manufactured in 2016. At one time, a BlackBerry was the very peak of mobile phone technology. With its internal messaging system, generous sized screens, and keyboards BlackBerry had over $20 billion in revenue in 2011. However, just five years later those revenues had collapsed by 90%. Now, the company has been essentially re-born creating “intelligent security software and services to enterprises and governments around the world.” (Chart from chartr.co)

(Sources: All index- and returns-data from Yahoo Finance; news from Reuters, Barron’s, Wall St. Journal, Bloomberg.com, ft.com, guggenheimpartners.com, zerohedge.com, ritholtz.com, markit.com, financialpost.com, Eurostat, Statistics Canada, Yahoo! Finance, stocksandnews.com, marketwatch.com, wantchinatimes.com, BBC, 361capital.com, pensionpartners.com, cnbc.com, FactSet.) Securities offered through Registered Representatives of Cambridge Investment Research Inc., a broker-dealer, member FINRA/SIPC. Advisory Services offered through Cambridge Investment Research Advisors, a Registered Investment Adviser. Strategic Investment Partners and Cambridge are not affiliated. Indices mentioned are unmanaged and cannot be invested into directly. Past performance is no guarantee of future results.
