
1-20-20 Weekly Market Update
The very Big Picture
The long-term valuation of the market is commonly measured by the Cyclically Adjusted Price to Earnings ratio, or “CAPE”, which smooths-out shorter-term earnings swings in order to get a longer-term assessment of market valuation. A CAPE level of 30 is considered to be the upper end of the normal range, and the level at which further PE-ratio expansion comes to a halt (meaning that further increases in market prices only occur as a general response to earnings increases, instead of rising “just because”). The market is currently at that level.
Of course, a “mania” could come along and drive prices higher – much higher, even – and for some years to come (and we may very well be in the throes of a more muted sort of mania right now, or very nearly-so). Manias occur when valuation no longer seems to matter, and caution is thrown completely to the wind – as buyers rush in to buy first, and ask questions later. Two manias in the last century – the “Roaring Twenties” of the 1920s, and the “Tech Bubble” of the late 1990s – show that the sky is the limit when common sense is overcome by a blind desire to buy. But, of course, the piper must be paid, and the following decade or two were spent in Secular Bear Markets, giving most or all of the mania-gains back.
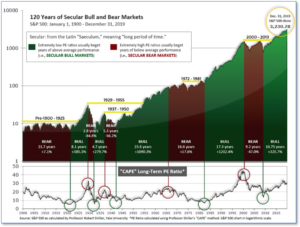
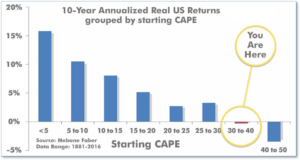
See Fig. 1 for the 100-year view of Secular Bulls and Bears. The CAPE is now at 31.83, up slightly from the prior week’s 31.31, above the level reached at the pre-crash high in October, 2007. Since 1881, the average annual return for all ten-year periods that began with a CAPE around this level have been flat to slightly-negative (see Fig. 2).
Note: We do not use CAPE as an official input into our methods. However, if history is any guide – and history is typically ‘some’ kind of guide – it’s always good to simply know where we are on the historic continuum, where that may lead, and what sort of expectations one may wish to hold in order to craft an investment strategy that works in any market ‘season’ … whether current one, or one that may be ‘coming soon’!
The Big Picture:
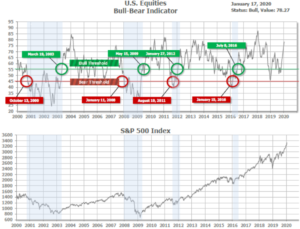
As a reading of our Bull-Bear Indicator for U.S. Equities (comparative measurements over a rolling one-year timeframe), we remain firmly in Cyclical Bull territory.
In the Intermediate and Shorter-term Picture:
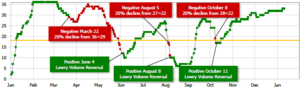
The Shorter-term (weeks to months) Indicator (see Fig. 4) is positive. The indicator ended the week at 34, up 1 from the prior week’s 33. Separately, the Intermediate-term Quarterly Trend Indicator – based on domestic and international stock trend status at the start of each quarter – was positive entering January, indicating positive prospects for equities in the first quarter of 2020.
The Complete Picture:
As a counting-up of the number of all our indicators that are ‘Up’ for U.S. Equities, we remain in ‘Positive’ territory. This status is drawn from a scale that goes from Negative, to Mostly Negative, to Neutral, to Mostly Positive, to Positive, and totals-up current readings based on a multitude of timeframes (days/weeks/months/quarters/years, the ‘years’ being the Cyclical Bull or Bear reading).
In the Markets:
U.S. Markets: Most major U.S. indexes hit record highs again this week as investors welcomed the signing of the “phase one” trade deal between the U.S. and China. Small caps led the way with the Russell 2000 rebounding 2.5% after three weeks of declines. The Dow Jones Industrial Average added over 524 points lifting the index above the 29,000-level, closing at 29,348—a gain of 1.8%. The technology-heavy NASDAQ Composite rose for a seventh consecutive week, adding 2.3%, while the large cap S&P 500 added 2.0%. The S&P 400 midcap index rose 2.2%.
International Markets: Most major international indexes were positive, but not to the extent of the U.S. Canada’s TSX gained 1.9%, while the UK’s FTSE 100 added 1.1%. On Europe’s mainland France’s CAC 40 rose 1.1%, Germany’s DAX added 0.3%, and Italy’s Milan FTSE finished up 0.5%. In Asia, China’s Shanghai Composite was the only major index finishing in the red, ending down -0.5%. Japan’s Nikkei added 0.8%. As grouped by Morgan Stanley Capital International, developed markets finished the week up 1.3%, while emerging markets added 1.4%.
Commodities: Gold ended the week essentially flat, up just 0.01% to $1560.30 an ounce. Silver retreated -0.2% to $18.07 an ounce. Oil declined for a second week in a row. West Texas Intermediate crude gave up -0.8% to $58.58 per barrel. The industrial metal copper, seen by some analysts as a barometer of global economic health due to its wide variety of uses, rose for a second week adding 1.1%.
U.S. Economic News: The number of Americans seeking first-time unemployment benefits fell for a fifth consecutive week and held near a 50-year low. The Labor Department reported initial jobless claims declined by 10,000 to 204,000 last week. Economists had predicted a reading of 220,000. In addition, the monthly average of new claims dropped to 216,250 from 224,000. The four-week average filters out some of the weekly ups and downs in claims. The number of people already collecting unemployment benefits, known as “continuing claims”, decreased by 37,000 to 1.77 million.
The Labor Department also reported that the number of job openings experienced their biggest drop in more than four years in November. Job openings tumbled 561,000 to 6.80 million in the latest Job Openings and Labor Turnover Survey (JOLTS). It was the biggest drop since August of 2015 and pushed job openings to their lowest level since March of 2018. Economists said the decline in vacancies and only moderate hiring were potentially signaling that employers were throttling back demand for workers. Chris Rupkey, chief economist at MUFG in New York stated, “The labor market may be starting to lose its shine and may have peaked. Anyone holding out for their dream job may have already missed the boat.”
The number of new homes under construction soared last month to their highest level in 13 years, according to the Census Bureau. U.S. housing starts surged nearly 17% in December to a seasonally-adjusted annual rate of 1.61 million. Economists had forecast housing starts would increase to just 1.38 million units. The data suggested the housing market recovery was back on track, supported by low mortgage rates. Year-over-year, housing starts increased 40.8% in December. An estimated 1.290 million housing units were started in 2019, up 3.2% compared to 2018.
U.S. retailers ended last year with a solid increase in December holiday sales, the Commerce Department reported. In a positive sign for the overall economy, most retailers posted higher sales in December and finishing out the holiday season on a strong note. Retail sales increased 0.3% last month, just a tick below economists’ forecasts. Every major group except auto dealers and department stores reported stronger sales. If auto receipts are set aside, retail sales rose a robust 0.7% in the final month of 2019. For the full year, retail sales climbed a healthy 5.8%, slightly above the average for the past 30 years. Economists at Oxford Economics wrote in a note to clients, “The healthy 0.3% advance in retail sales at year-end confirmed that consumer spending remained a solid driver of economic activity heading into 2020.” Of course, the good news wasn’t evenly spread across the retail landscape, with several major retailers reporting disappointing Christmas sales. Kohl’s, for example, reported a ‑0.2% decline in same-store sales for the November-December period, noting particular weakness in women’s apparel.
Sentiment among the nation’s small business owners slipped last month, as businesses continued to struggle with finding qualified workers. The National Federation of Independent Business (NFIB) reported its index of small-business optimism declined 2 points to 102.7. Economists had expected a decline of only 0.3 point. In the NFIB report, six of the ten index components fell, while two improved and two remained unchanged. The economic outlook and sales expectations components both increased, but so did uncertainty. Finding qualified workers remained the top concern at most firms. Ian Shepherdson, chief economist at Pantheon Macroeconomics noted, “The dip in capex plans is disappointing but the index is marginally higher than a year ago so it still points to a rebound in capex next spring, though the first quarter likely will be soft.”
Despite its fastest rise in eight years, the overall pace of inflation remains relatively low, according to the latest data from the Bureau of Labor Statistics. The consumer price index (CPI) rose 0.2% last month, lifting the cost of living over the past 12 months to 2.3% – the highest CPI level since October 2018. Economists had forecast a 0.3% advance. Yet most economists say inflation is still low by historical standards. Much of last year’s price increases were concentrated in just a few areas and other measures suggest that U.S. inflation is rising less than 2% a year. Core CPI, which strips out the volatile food and energy categories, ticked up just 0.1% last month. The Federal Reserve’s preferred inflation gauge, the Personal Consumption Expenditures Index (PCE), remained sharply lower than the CPI – up just 1.5% in the 12 months through November.
The Federal Reserve’s “Beige Book”, a summary and analysis of economic activity and conditions from each of the Fed’s member banks, stated that economic activity continued to expand “modestly” over the last six weeks of last year. Two districts (Richmond and Dallas) reported growth at an above-average rate, while three others (Philadelphia, St. Louis, and Kansas City) all reported sub-par performance. Expectations of the near-term outlook “remained modestly favorable”. Manufacturing activity was flat, while consumer spending was powering the economic growth. Tom Simons, senior money-market economist for Jefferies stated, “This Beige Book diverges from other reports of the past year in that it shows more pockets of weakness, especially in the war-weary manufacturing sector. The tone…remains positive but not overwhelmingly so.”
Business activity rose slightly in the New York region and exceeded analysts’ expectations, according to the New York Federal Reserve. The New York Fed reported its business conditions index rose 1.5 points in January to 4.8. Economists had expected a reading of 3.6. In the details, the new orders index rose 4.9 points, while shipments fell 0.9 points to 8.6. Unfilled orders continued to decline. The index for future business conditions edged down 3 points to 23.6. Josh Shapiro, chief U.S. economist at MFR Inc. described the report as “lackluster”.
International Economic News: According to a Reuter’s poll of economists, a revival in the Canadian economy may already be underway. Nearly 70% of economists who provided a year-end outlook expected Canada’s central bank to keep its key interest rate on hold at 1.75% this year. That compares to just over half in a poll taken before the previous meeting in early December. All but one respondent in the latest poll expected rates to remain unchanged when the Bank of Canada meets next week, in line with the futures market’s view. Optimism among economists was partly driven by a trade agreement signed by China and the United States this week after an 18-month trade war and by the latest labor market data, which showed more jobs than expected were added in December. Veronica Clark, an economist at Citi wrote, “The BoC should be encouraged by the rebound in employment, remaining in a data-dependent mode and unlikely to cut rates in 2020.”
Consumers in the United Kingdom cut back on spending for the fifth consecutive month, adding to signs of an economic weakening. Analysts noted the reading may prompt the Bank of England to cut interest rates later this month. Data from the United Kingdom’s Office for National Statistics showed sales volumes fell by 0.6% from November, defying the median forecast of a rise of 0.5% in a Reuter’s poll of economists. Sales in monthly terms have not risen since July, the longest such run since records began in 1996.
On Europe’s mainland, France’s central bank said the historic pension reform strike stunted growth in the final quarter of last year. The central bank said France’s longest continuous transportation strike shaved up to 0.1% off fourth-quarter growth in 2019, Banque de France governor Francois Villeroy de Galhau told a parliamentary finance committee. An estimated 10% of businesses, mainly in the hotel, restaurant and transport industries have been affected by the stoppage, he said. De Galhau described the economic impact of the strike, as “limited”, but said this did not “diminish in any way the real discomfort suffered by millions of our fellow citizens, employees and merchants.” The government wants to merge 42 existing pension plans into a single, points-based system it insists will be fairer and more transparent. Unions claim the move will cause millions to work longer for smaller retirement payouts.
Germany, Europe’s economic powerhouse, saw its economic growth slow to its lowest rate in six years. Statistics office Destatis reported that Germany’s gross domestic product grew at just 0.6% last year, its weakest reading since the 0.4 expansion in 2013. Global trade tensions, export weakness, and the persistent downturn in the automotive industry hit Germany’s economy especially hard. Claus Michelsen, head of forecasting and economic policy at the DIW research institute in Berlin stated, “Without strong private consumption and the construction sector the German economy would not have grown at all.” Most analysts believe that the economy will perform better – if only slightly – in 2020, with forecasters expecting growth rates of about 1%.
Chinese officials said the country emerged from 2019 with an official economic growth rate of 6.1%, within the government’s target range of 6-6.5%, but its lowest level in nearly three decades. However, China’s outlook remains uncertain and some private-sector economists warned that growth could slip even further this year, to below 6%. Rising debt, cooling domestic demand and fallout from the trade war with the United States are all weighing on the world’s second-largest economy. Trade tensions, at least, cooled off somewhat this week. Beijing and Washington signed a “phase one” trade deal, which removes a little bit of pressure, at least in the short term.
Japan posted record monthly growth for machinery orders in November, a positive sign for the world’s third largest economy. Japan’s Cabinet Office reported core orders, an indicator of capital spending in the coming six to nine months, rose 18.0% in November from the previous month. That marked the biggest monthly gain since comparable data became available in 2005. The jump in November orders was largely driven by big-ticket items, such as orders for railway cars, transport equipment and thermal hydraulic motors. It blew away the 3.2% gain forecast by economists. However, Tom Learmouth, Japan economist at Capital Economics cautioned clients not to read too much into the report. Learmouth wrote, “The surge in ‘core’ machinery orders in November was largely due to a spike in transport and postal activities and we still expect non-residential investment to fall this year.”
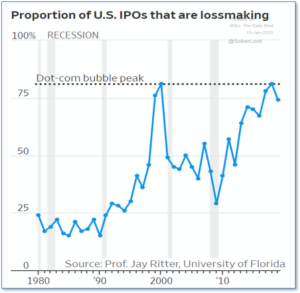
Finally: As multiple major market indexes have now recorded solid weekly gains for almost two months, more and more analysts are beginning to sound the alarm bells of bubble warnings. Brad Lamensdorf, of lmtr.com, pointed to a chart originally published in the Wall Street Journal (below), showing the proportion of Initial Public Offerings (IPOs) that are money-losers. Noting that the percentage of loser IPOs has reached the crazed peak of the dot-com bubble, Lamensdorf writes “Why does this happen? Generally, because investors have lost their sense of reality. They are willing to buy stocks on hyped stories instead of the facts. Put another way, investment bankers are willing to stuff the market with over-priced stocks of little value as long as the public is willing to buy them.”
(Sources for this week’s SITREP: All index- and returns-data from Yahoo Finance; news from Reuters, Barron’s, Wall St. Journal, Bloomberg.com, ft.com, guggenheimpartners.com, zerohedge.com, ritholtz.com, markit.com, financialpost.com, Eurostat, Statistics Canada, Yahoo! Finance, stocksandnews.com, marketwatch.com, wantchinatimes.com, BBC, 361capital.com, pensionpartners.com, cnbc.com, FactSet) Securities offered through Registered Representatives of Cambridge Investment Research Inc., a broker-dealer, member FINRA/SIPC. Advisory Services offered through Cambridge Investment Research Advisors, a Registered Investment Adviser. Strategic Investment Partners and Cambridge are not affiliated.
Indices mentioned are unmanaged and cannot be invested into directly. Past performance is no guarantee of future results. All Investing involves risk. Depending on the types of investments, there may be varying degrees of risk. Investors should be prepared to bear loss, including total loss of principal.