
1-25-21 Weekly Market Update
The very Big Picture
The long-term valuation of the market is commonly measured by the Cyclically Adjusted Price to Earnings ratio, or “CAPE”, which smooths-out shorter-term earnings swings in order to get a longer-term assessment of market valuation. A CAPE level of 30 is considered to be the upper end of the normal range, and the level at which further PE-ratio expansion comes to a halt (meaning that further increases in market prices only occur as a general response to earnings increases, instead of rising “just because”). The market was recently at that level.
Of course, a “mania” could come along and drive prices higher – much higher, even – and for some years to come. Manias occur when valuation no longer seems to matter, and caution is thrown completely to the wind – as buyers rush in to buy first, and ask questions later. Two manias in the last century – the “Roaring Twenties” of the 1920s, and the “Tech Bubble” of the late 1990s – show that the sky is the limit when common sense is overcome by a blind desire to buy. But, of course, the piper must be paid, and the following decade or two were spent in Secular Bear Markets, giving most or all of the mania-gains back.
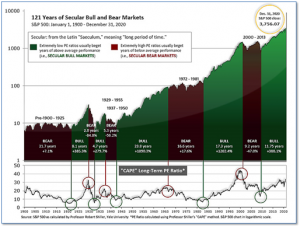
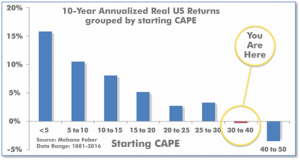
See Fig. 1 for the 100-year view of Secular Bulls and Bears. The CAPE is now at 34.92, up from the prior week’s 34.26. Since 1881, the average annual return for all ten-year periods that began with a CAPE in the 30-40 range has been slightly negative (see Fig. 2).
Note: We do not use CAPE as an official input into our methods. However, if history is any guide – and history is typically ‘some’ kind of guide – it’s always good to simply know where we are on the historic continuum, where that may lead, and what sort of expectations one may wish to hold in order to craft an investment strategy that works in any market ‘season’ … whether current one, or one that may be ‘coming soon’!
The Big Picture:
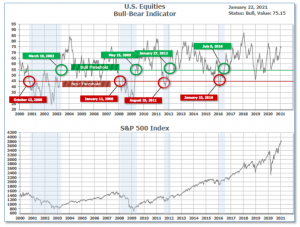
The ‘big picture’ is the (typically) years-long timeframe – the timeframe in which Cyclical Bulls and Bears operate. The U.S. Bull-Bear Indicator is in Cyclical Bull territory at 75.15 down from the prior week’s 74.44.
In the Quarterly- and Shorter-term Pictures
The Quarterly-Trend Indicator based on the combination of U.S. and International Equities trend-statuses at the start of each quarter – was Positive entering January, indicating positive prospects for equities in the first quarter of 2021.
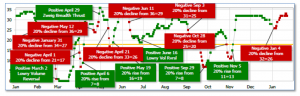
Next, the short-term(weeks to months) Indicator for US Equities turned negative on January 4 and ended the week at 32, unchanged from the prior week.
In the Markets:
U.S. Markets: The major indexes moved higher for the week, hitting new intraday highs before a pullback on Friday. The Dow Jones Industrial Average rose 183 points closing at 30,997 – a gain of 0.6%. The technology-heavy NASDAQ Composite surged 4.2% to 13,543. By market cap, the large cap S&P 500 rose 1.9%, while the midcap S&P 400 and small cap Russell 2000 added 1.6% and 2.1%, respectively.
International Markets: Major international markets finished mixed for the week. Canada’s TSX declined -0.4% along with the United Kingdom’s FTSE which gave up -0.6%. On Europe’s mainland, France’s CAC 40 declined -0.9% while Germany’s DAX gained 0.6%. In Asia, China’s Shanghai Composite rose 1.1% and Japan’s Nikkei gained 0.4%. As grouped by Morgan Stanley Capital International, developed markets rose 1% while emerging markets gained 2.7%.
Commodities: Precious metals rose last week, with gold rising 1.4% to $1856.20 per ounce and silver adding 2.8% to $25.56. West Texas Intermediate crude oil had its first down week in three declining -0.3% to $52.27 per barrel. The industrial metal copper, viewed by some as a barometer of world economic health due to its wide variety of uses, ended the week up 0.7%.
U.S. Economic News: The number of Americans applying for first-time unemployment benefits fell slightly last week, but remained stubbornly high. The Labor Department reported initial jobless claims declined by 26,000 to a seasonally-adjusted 900,000 last week. Economists had expected a reading of 925,000. For perspective, claims had been running in the low 200,000’s just before the pandemic took hold. Continuing claims, which counts the number of people already receiving benefits, declined by 127,000 to 5.18 million. That number is reported with a one-week delay.
Confidence among the nation’s homebuilders remained strong but ticked down as coronavirus cases rose and the cost of building materials increased. The National Association of Home Builders’ (NAHB) reported its monthly confidence index dropped 3 points to 83 in January. Economists had expected a reading of 85. Still, the index remains far above 50—the dividing line between growth and contraction. In the details, the index that measures sentiment regarding current sales fell 2 points to 90, while the index of expectations of future sales also declined 2 points to 83. The gauge regarding prospective buyers slipped 5 points to 68. By region, confidence weakened the most in the Northeast, followed by smaller declines in the West and South. Confidence ticked up 2 points in the Midwest.
The Census Bureau reported home builders started construction at a seasonally-adjusted annual rate of 1.67 million in December – a 5.8% increase over November. Furthermore, permitting of new homes, an indicator of future building activity, rose by 4.5%. Both figures came in above analysts’ expectations reflecting growth in the single-family sector. On a monthly basis, single-family starts were up 12%, while single-family permits were up 7.8%. On a regional basis, all parts of the country saw permitting activity increase except for the Northeast, where it fell 7.2%.
The U.S. economy got off to a good start in 2021 according to a pair of surveys from analytics firm IHS Markit. Markit reported its purchasing managers’ indexes (PMI) for both the services and manufacturing sides of the economy improved this month. The PMI for the much larger services side of the economy rose to a two-month high of 57.5 in January, an increase of 2.7 points. Furthermore, the PMI for the manufacturing side of the economy climbed 2 points to a record 59.1. Of concern, however, was that hiring was especially soft among services companies (which employ more than 80% of America’s workforce). Chris Williamson, chief IHS business economist stated, “U.S. businesses reported a strong start to 2021, buoyed by hopes that vaccine developments will mean the worst of the pandemic is behind us, and that the new administration will provide a stable and supportive environment for stronger economic growth.”
Factory activity in the mid-Atlantic region surged at the beginning of the year to its highest level since the pandemic began, according to data from the Philadelphia Federal Reserve. The Philly Fed reported its business conditions index jumped to 26.5 in January—a 17.4 point increase from December. The reading was far above the consensus forecast of 10.5. In the details, the six-month outlook rose to 52.8, from 43.1 last month. New orders, employment and shipments all jumped in January. Of concern, there were signs of inflationary pressures in the supply chain. Manufacturing has been a bright spot in the U.S. economy as it’s more insulated from the stringent social distancing guidelines that weigh heavily on the services sector. Oren Klachkin, lead U.S. economist at Oxford Economics wrote in a note, “Looking ahead, manufacturing will stay on an upbeat track though we expect growth to soften as vaccines and the economy’s reopening unleash pent-up demand for deeply-damaged services.”
International Economic News: Bank of Canada governor Tiff Macklem said at a news conference that Canada’s economy is flush with enough stimulus to survive the current downturn and doesn’t need additional help from monetary policy. Macklem said policy makers considered whether more measures were needed to stimulate growth, including a cut of their 0.25% overnight policy rate, but determined that “we have a considerable amount of stimulus in place.” The bank is expecting a quick recovery from a shrinking economy in the first quarter of 2021, to extraordinarily strong growth of 4% in 2021 and 5% the year after.
Across the Atlantic, the Bank of England’s chief economist Andy Haldane made a similar forecast stating he expects Britain’s economy to begin to recover “at a rate of knots” [a British idiom for “very fast”] from the second quarter of this year, as vaccines against COVID-19 continue to roll out. Haldane said the huge economic shock delivered by the initial lockdown in March and April last year, when output fell 25%, was likely to prove more transient than the 2008-09 global financial crisis that generated a large overhang of bad debts. Britain is now rolling out vaccines faster than almost anywhere else in the world and the government hopes to be able to ease restrictions significantly by Easter and rein in costly economic support measures. “If we get that recovery that I expect to start coming on stream, probably at a rate of knots from the second quarter, that will hopefully…improve the prospects of re-employment,” Haldane said.
On Europe’s mainland, business activity in the Eurozone fell to a two-month low this month, preliminary data from Markit showed. The region is grappling with growing COVID-19 infection rates and tighter restrictions as an apparent new strain of the virus spread. Markit’s flash composite PMI for the euro zone, which looks at activity across both manufacturing and services, dropped to 47.5 January, versus 49.1 in December. A reading below 50 represents a contraction in activity. Chris Williamson, chief business economist at IHS Markit, said a double-dip recession for the Eurozone was looking “increasingly inevitable.” “Tighter Covid-19 restrictions took a further toll on businesses in January,” he said in a statement. European Central Bank President Christine Lagarde acknowledged that the pandemic still posed “serious risks” to the bloc’s economy.
Just over a year after the world’s first coronavirus cases were identified in China, the country’s economy has bounced back from the pandemic. China’s economy grew by 2.3% last year, according to data from the country’s National Bureau of Statistics. The steady economic recovery was largely expected, and puts China on a track that other countries haven’t achieved. Nicholas Lardy, a China specialist at the Peterson Institute of International Economics stated, “It’s likely that China could be the only major economy that has significant positive economic growth in 2020.” China also reported a record $75.4 billion surplus in November, after exports to the rest of the world jumped 21.1% compared to the previous year. Despite the tariffs imposed by former U.S. President Donald Trump, much of that increase was accounted for by exports to the United States.
Japan’s government maintained its view that the Japanese economy is “picking up” in its assessment for January, despite growing fears that the latest state of emergency imposed this month over the novel coronavirus could deal it a fresh blow. In its monthly report, the Cabinet Office revised its views downward on private consumption and corporate business sentiment amid a third wave of virus infections. On a positive note, the report also showed an upgrade of its assessments of business investment and housing construction as the initial shock of the pandemic on the world’s third-largest economy has eased. “The Japanese economy is still in a severe situation due to the novel coronavirus, but it is showing movements of picking up,” the office said, using the same wording for the seventh month in a row.
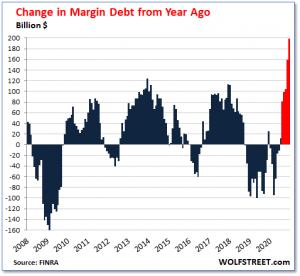
Finally: Video game retailer GameStop (a recent stock of interest for internet day traders) surged 51% on Friday and over 83% last week on no news that would remotely justify such a move. That kind of trading action is reminiscent of the height of the dot.com era insanity. Also reminiscent of that time is the current level of margin debt—the amount of money individuals and institutions borrow against their stock holdings in order to buy even more stock. Margin debt spiked by $56 billion in December and $53 billion in November—by far the two largest month-to-month increases on record. Along with spikes in the price of Bitcoin, any electric vehicle maker (or any manufacturers rumored to be thinking about making electric vehicles), and any penny stocks with a similar name to something Elon Musk mentioned in a tweet, now add margin debt as further evidence of a very “frothy” market.
(Sources: All index- and returns-data from Yahoo Finance; news from Reuters, Barron’s, Wall St. Journal, Bloomberg.com, ft.com, guggenheimpartners.com, zerohedge.com, ritholtz.com, markit.com, financialpost.com, Eurostat, Statistics Canada, Yahoo! Finance, stocksandnews.com, marketwatch.com, wantchinatimes.com, BBC, 361capital.com, pensionpartners.com, cnbc.com, CNBC, FactSet.) Securities offered through Registered Representatives of Cambridge Investment Research Inc., a broker-dealer, member FINRA/SIPC. Advisory Services offered through Cambridge Investment Research Advisors, a Registered Investment Adviser. Strategic Investment Partners and Cambridge are not affiliated. Indices mentioned are unmanaged and cannot be invested into directly. Past performance is no guarantee of future results.