
1-14-19 Weekly Market Update
The very big picture:
In the “decades” timeframe, the current Secular Bull Market could turn out to be among the shorter Secular Bull markets on record. This is because of the long-term valuation of the market which, after nine years, has reached the upper end of its normal range.
The long-term valuation of the market is commonly measured by the Cyclically Adjusted Price to Earnings ratio, or “CAPE”, which smooths out shorter-term earnings swings in order to get a longer-term assessment of market valuation. A CAPE level of 30 is considered to be the upper end of the normal range, and the level at which further PE-ratio expansion comes to a halt (meaning that increases in market prices only occur in a general response to earnings increases, instead of rising “just because”).
Of course, a “mania” could come along and drive prices higher – much higher, even – and for some years to come. Manias occur when valuation no longer seems to matter, and caution is thrown completely to the wind as buyers rush in to buy first and ask questions later. Two manias in the last century – the 1920’s “Roaring Twenties” and the 1990’s “Tech Bubble” – show that the sky is the limit when common sense is overcome by a blind desire to buy. But, of course, the piper must be paid and the following decade or two are spent in Secular Bear Markets, giving most or all of the mania gains back.

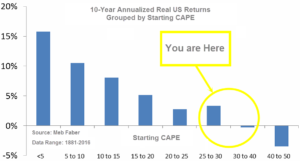
See Fig. 1 for the 100-year view of Secular Bulls and Bears. The CAPE is now at 28.53, up from the prior week’s 28.02, about the level reached at the pre-crash high in October, 2007. Since 1881, the average annual return for all ten year periods that began with a CAPE around this level have been in the 0% – 3%/yr. range. (see Fig. 2).
In the big picture:
The “big picture” is the months-to-years timeframe – the timeframe in which Cyclical Bulls and Bears operate. The U.S. Bull-Bear Indicator (see Fig. 3) is in Cyclical Bull territory at 48.19, up from the prior week’s 46.49.

In the intermediate and Shorter-term picture:
The Shorter-term (weeks to months) Indicator (see Fig. 4) turned positive on November 28th. The indicator ended the week at 21, up sharply from the prior week’s 7. Separately, the Intermediate-term Quarterly Trend Indicator – based on domestic and international stock trend status at the start of each quarter – was negative entering January, indicating negative prospects for equities in the first quarter of 2019.

Timeframe summary:
In the Secular (years to decades) timeframe (Figs. 1 & 2), the long-term valuation of the market is simply too high to sustain rip-roaring multi-year returns. The Bull-Bear Indicator (months to years) remains positive (Fig. 3), indicating a potential uptrend in the longer timeframe. In the intermediate timeframe, the Quarterly Trend Indicator (months to quarters) is negative for Q1, and the shorter (weeks to months) timeframe (Fig. 4) is positive. Therefore, with two indicators positive and one negative, the U.S. equity markets are rated as Neutral.
In the markets:
U.S. Markets: U.S. stocks rose for a third consecutive week as it appeared that leaders in China and the U.S. may be making progress in resolving their trade dispute. The small cap Russell 2000 index outperformed mid and large cap indexes, becoming the last major benchmark to emerge from bear market territory (a decline of over 20% from a recent high). The Dow Jones Industrial Average surged 562 points, or 2.4%, to close at 23,995. The technology-heavy NASDAQ Composite enjoyed its third consecutive week of gains, rising 3.5%. By market cap, the large cap S&P 500 index rose 2.5% and the mid cap S&P 400 index gained 4.7%, while the small cap Russell 2000 surged 4.8%.
International Markets: Canada’s TSX gained 3.6%, while the United Kingdom’s FTSE rose 1.2%. Markets were green on the European mainland as well. France’s CAC 40 rose 0.9%, Germany’s DAX added 1.1%, and Italy’s Milan FTSE gained 2.4%. In Asia, China’s Shanghai Composite rose 1.5% and Japan’s Nikkei rebounded 4.1% from five consecutive weeks of losses. As grouped by Morgan Stanley Capital International, emerging markets rose 2.6% last week while developed markets finished up 1.9%.
Commodities: Energy followed through with a second week of healthy gains. West Texas Intermediate crude oil surged for a second week, up 7.6% to $51.59 per barrel. Precious metals finished the week mixed. Gold added 0.3% to close at $1289.50 an ounce, while Silver retreated -0.8% to $15.66 an ounce. The industrial metal copper, seen as a barometer of world economic health due to its variety of uses, added 0.55% last week.
U.S. Economic News: The number of Americans seeking new unemployment benefits fell sharply last week, a positive sign for the labor market and the overall economy going into the new year. The Labor Department reported the number of initial jobless claims declined by 17,000 to just 216,000, significantly below the consensus estimate of 227,000. The more stable monthly average of new claims edged up slightly by 2,500 to 221,750. Continuing claims, which counts the number of people already receiving benefits, fell by 28,000 to 1.72 million. That number fell below the 2 million mark last spring for the first time since the turn of the century and has remained near a 45-year low for months. Prompted by the government shutdown, some 4,760 federal employees filed for benefits during the last week of December.
The number of job openings fell to their lowest level since early summer in November, but the number of positions still far exceeds the number of unemployed Americans. The Labor Department’s Job Openings and Labor Turnover Survey (JOLTS) reported the number of job openings fell to 6.89 million from 7.13 million but remained well above the 6 million people classified by the government as unemployed. Declines in job openings affected most segments of the economy with construction hit particularly hard. However, openings for transportation and warehousing increased ahead of the holiday shopping season. The “quits rate”, known to be closely watched by the Federal Reserve, the rationale being that presumably one would only leave a position for a more lucrative one, fell for the second month in a row to 2.5% among private-sector workers. While near an all-time high, that number appears to be leveling off.
A sharp decline in energy prices and a stronger dollar put downward pressure on consumer prices, according to the latest reading of the Consumer Price Index (CPI). The CPI slipped 0.1% in December, its first decline since March and matching forecasts. The decline was led by a 3.5% decline in energy prices, the most since February 2016, due mostly to a drop in the price of gasoline. However, food price rose 0.4%, the most since May 2014. Removing the often-volatile food and energy categories, so-called “core” CPI rose 0.2%, matching estimates. Year-over-year, CPI moderated to 1.9% – its slowest pace since July 2017 – while core inflation remained essentially unchanged at 2.2%.
Sentiment among the nation’s small business owners drifted down last month as the outlook for the economy deteriorated. The National Federation of Independent Business (NFIB) Optimism Index fell 0.4 point last month to 104.4, its fourth decline in a row. The reading is at its lowest level since October of 2017. In the details, both the current sales trend and expected real sales growth weakened, and capital expenditure plans were their softest since November 2016. However on a positive note, current job postings hit a record high, and hiring plans for the next three months also picked up. A near-record 54% of firms continued to report few or no qualified job applicants for open positions.
According to the Institute for Supply Management (ISM), service-oriented firms such as banks, retailers, and software-developers grew at their slowest pace since midsummer last month, but overall business nonetheless remained brisk. ISM’s non-manufacturing index slipped 3.1 points to a five-month low of 57.6 in December, missing consensus estimates of a 2.3-point decline. The reading showed that while services activity has moderated, the level is still historically consistent with above-trend growth. The index had hit a 21-year high of 61.6 in September. Overall, the reading remained on solid footing. Numbers over 50 are viewed as positive for the economy, and readings over 55 are considered exceptional – so 61.6 is still a great number.
International Economic News: Likely taking a hint from the market turmoil in the aftermath of the United States’ Federal Reserve rate hike, the Bank of Canada left its interest rate unchanged at 1.75% this week. The Bank of Canada noted heightened concern over the health of Canada’s housing market and its debt-burdened households’ ability to manage higher interest rates as reasons for the lack of action. In addition, the central bank noted the negative effects of lower oil prices and the trade tensions with the United States that have created headwinds and forced the bank off a direct path to higher interest rates. The central bank said in its new policy statement “The appropriate pace of rate increases will depend on how the outlook evolves, with a particular focus on developments in oil markets, the Canadian housing market, and global trade policy.”
The United Kingdom’s economic growth hit a six-month low as manufacturing slowed. The UK economy expanded at its weakest pace in the three months to November as industrial output dropped 1.5% on the year—its biggest decline since August of 2013. Overall, the UK’s gross domestic product in the three months to November was 0.3% higher than the previous three-month period, but down from the 0.4% quarterly growth rate seen in October. The Office for National Statistics reported manufacturers suffered their longest period of monthly declines in output since the financial crisis due to a decline in overseas demand. Britain’s economic growth was driven primarily by its services sector as well as the construction industry.
On Europe’s mainland, the French government now has what has become a convenient excuse for its lower growth rate—the anti-government “yellow vest” protestors. What started out as a simple protest against French President Emmanuel Macron’s steep fuel taxes to combat global warming, spiraled into an eighth weekend of multi-city violent protests that have now claimed multiple lives. French Finance Minister Bruno Le Maire is now blaming the riots for a slowdown in France’s economic growth. Mr. Le Maire warned that the crisis would shave at least 0.1% off growth in the final quarter in 2018. The Bank of France later confirmed his warning, stating the economy would grow by just 0.2% in the fourth quarter, down by half from the 0.4% expected in previous estimates.
Germany, Europe’s biggest economy, posted more disappointing data and raised fears that last year’s slowdown could spill into 2019. Industrial production in Germany dropped unexpectedly in November, the latest sign of headwinds in the global economy. Production in Germany’s key industrial sector fell 1.9% in November from the previous month. The reading was far below analysts’ forecasts of a 0.3% gain. It was the second consecutive monthly fall in industrial output and followed a drop in new manufacturing orders. German officials have played down the signs of economic softness, attributing them to temporary factors that would “soon fade”. Germany’s Economy Ministry also maintained that the drop in industrial production partly reflected extra vacation days as well as bottlenecks in the auto sector due to compliance with new emissions standards.
While it hasn’t gotten much attention in the western press, China’s benchmark stock index was the world’s worst‑performing last year with its 25% drop. And as tech-giant Apple showed in its earnings report, a slowing China could have powerful ramifications for the U.S. market. The International Monetary Fund estimates that the Chinese economy will grow just 6.2% in 2019 down 0.3% from 2018, but notes that a sustained trade war with the United States could cut growth much more. Already, some warning signs are blinking red. Factory output contracted for the first time in two years and exports, which had increased 15.5% in October, were up just 5.4% in November. The internal economy is also slowing as retail sales increased 8.1% in November—a positive gain, but the slowest in 15 years.
An indicator measuring the Japanese public’s outlook of future economic conditions fell to its lowest level since Prime Minister Shinzo Abe began his current stint in office. The Bank of Japan reported its opinion survey showed 39.8% of respondents believe economic conditions will worsen in the next year, compared with just 7.8% who expect improvement. The difference is the highest it has been since December 2012 when Abe took office for the second time. The Bank of Japan suspects the poor reading stems from the global stock slide that began in October. Furthermore, 54.2% of respondents say the Japanese economy has less potential to grow compared to the current level of growth, representing a two-year low. A full 33% of the people surveyed say incomes will shrink a year from now, compared with just 9.8% who say incomes will grow.
Finally: There’s no shortage of recent news stories covering the shrinking of the “middle class”. But what exactly is the “middle class”, and who is in it? According to a study by the Pew Research Center, it turns out that the definition of “middle class” varies greatly, and that “household size” is a major factor in the definition. Research website howmuch.net took the Pew data and plotted family size against income range, showing graphically how rising family size causes the income range definition of “middle class” to climb higher and higher.

(sources: all index return data from Yahoo Finance; Reuters, Barron’s, Wall St Journal, Bloomberg.com, ft.com, guggenheimpartners.com, zerohedge.com, ritholtz.com, markit.com, financialpost.com, Eurostat, Statistics Canada, Yahoo! Finance, stocksandnews.com, marketwatch.com, wantchinatimes.com, BBC, 361capital.com, pensionpartners.com, cnbc.com, FactSet) These are the opinions of WE Sherman and Co and not necessarily those of Cambridge, are for informational purposes only, and should not be construed or acted upon as individualized investment advice.
Securities offered through Registered Representatives of Cambridge Investment Research Inc., a broker-dealer, member FINRA/SIPC. Advisory Services offered through Cambridge Investment Research Advisors, a Registered Investment Adviser. Strategic Investment Partners and Cambridge are not affiliated.
Indices mentioned are unmanaged and cannot be invested into directly. Past performance is no guarantee of future results. All Investing involves risk. Depending on the types of investments, there may be varying degrees of risk. Investors should be prepared to bear loss, including total loss of principal