
9-3-2018 Weekly Market Update
The very big picture:
In the “decades” timeframe, the current Secular Bull Market could turn out to be among the shorter Secular Bull markets on record. This is because of the long-term valuation of the market which, after only eight years, has reached the upper end of its normal range.
The long-term valuation of the market is commonly measured by the Cyclically Adjusted Price to Earnings ratio, or “CAPE”, which smooths out shorter-term earnings swings in order to get a longer-term assessment of market valuation. A CAPE level of 30 is considered to be the upper end of the normal range, and the level at which further PE-ratio expansion comes to a halt (meaning that increases in market prices only occur in a general response to earnings increases, instead of rising “just because”).
Of course, a “mania” could come along and drive prices higher – much higher, even – and for some years to come. Manias occur when valuation no longer seems to matter, and caution is thrown completely to the wind as buyers rush in to buy first and ask questions later. Two manias in the last century – the 1920’s “Roaring Twenties” and the 1990’s “Tech Bubble” – show that the sky is the limit when common sense is overcome by a blind desire to buy. But, of course, the piper must be paid and the following decade or two are spent in Secular Bear Markets, giving most or all of the mania gains back.

See Fig. 1 for the 100-year view of Secular Bulls and Bears. The CAPE is now at 33.33, up from the prior week’s 33.03, and exceeds the level reached at the pre-crash high in October, 2007. This value is in the lower end of the “mania” range. Since 1881, the average annual return for all ten year periods that began with a CAPE around this level have been in the 0% – 3%/yr. range. (see Fig. 2).

In the big picture:
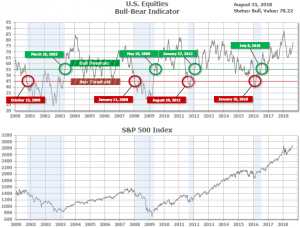
The “big picture” is the months-to-years timeframe – the timeframe in which Cyclical Bulls and Bears operate. The U.S. Bull-Bear Indicator (see Fig. 3) is in Cyclical Bull territory at 78.22, up from the prior week’s 76.57.
In the intermediate and Shorter-term picture:
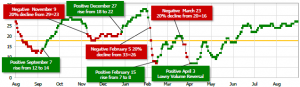
The Shorter-term (weeks to months) Indicator (see Fig. 4) turned positive on April 3rd. The indicator ended the week at 27, up from the prior week’s 26. Separately, the Intermediate-term Quarterly Trend Indicator – based on domestic and international stock trend status at the start of each quarter – was positive entering July, indicating positive prospects for equities in the third quarter of 2018.
Timeframe summary:
In the Secular (years to decades) timeframe (Figs. 1 & 2), the long-term valuation of the market is simply too high to sustain rip-roaring multi-year returns – but the market has entered the low end of the “mania” range, and all bets are off in a mania. The only thing certain in a mania is that it will end badly…someday. The Bull-Bear Indicator (months to years) is positive (Fig. 3), indicating a potential uptrend in the longer timeframe. In the intermediate timeframe, the Quarterly Trend Indicator (months to quarters) is positive for Q3, and the shorter (weeks to months) timeframe (Fig. 4) is positive. Therefore, with all three indicators positive, the U.S. equity markets are rated as Positive.
In the markets:
U.S. Markets: U.S. stocks recorded solid gains for the week, lifting most of the major indexes to all-time highs. The technology-heavy NASDAQ Composite index performed the best, crossing the psychologically-significant 8,000 threshold for the first time in history. The Dow Jones Industrial Average gained 174 points last week to close at 25,864, up 0.7%. The NASDAQ Composite surged 2.1% to close at 8109. By market cap, the large cap S&P 500 led the way rising 0.93%, while the small cap Russell 2000 and mid cap S&P 400 added 0.9% and 0.5%, respectively.
International Markets: Canada’s TSX fell -0.6%, while in Europe the United Kingdom’s FTSE fell -1.9%. On Europe’s mainland, France’s CAC 40 and Germany’s DAX were off -0.5% and -0.3%, respectively while Italy’s Milan FTSE declined a much larger -2.3%. In Asia, China’s Shanghai Composite plunged -4.2%, but Japan’s Nikkei followed last week’s advance with a further 1.2% gain. As grouped by Morgan Stanley Capital International developed markets finished the week down -0.5%, while developed markets rose a tiny 0.03%.
Commodities: Precious metals finished the week in the red with Gold down half a percent to $1206.70 an ounce and Silver, off a much steeper -2.4% to $14.44 per ounce. Major energy markets were up for the week. West Texas Intermediate crude oil added 1.6% closing at $69.80 per barrel, while North Sea Brent crude oil added over 3% to end the week at $77.71 per barrel. Copper, also called “Dr. Copper” by some analysts due to its seeming ability to forecast global economic health, finished the week down -1.1%.
August Summary: U.S. markets worked higher during the month of August. The Dow Jones Industrial Average rose 2.2%, the Nasdaq Composite gained 5.7%, and the large cap S&P 500 added 3%. The mid cap S&P 400 matched the performance of the large caps by rising 3%, while the small cap Russell 2000 gained 4.2%. International markets, by contrast, were almost all down in August. Canada’s TSX fell -1%, the United Kingdom’s FTSE gave up over -4%. On Europe’s mainland, France’s CAC 40 fell -1.9%, Germany’s DAX was off -3.5%, and Italy’s Milan FTSE plunged -8.8%. In Asia, China’s Shanghai Composite was off -5.3% while Japan’s Nikkei was a lonely gainer, improving by 1.4%. As grouped by Morgan Stanley Capital International, emerging markets finished the month down -3.8%, while developed markets were off -2.2%. Gold declined by -2.2% in August, while Silver plunged a much larger -7.2%. The industrial metal copper declined -5.7% in August. Brent crude oil rose 4.7%, along with West Texas Intermediate which added 1.5%.
U.S. Economic News: The Labor Department reported initial U.S. jobless claims at 213,000 last week, a rise of 3,000 from the previous week. Economists had forecast a reading of 212,000. More notably, the monthly average of claims, smoothed to iron out the weekly volatility, fell by 1,500 to 212,250—its lowest level since December 1969. Companies continue to report difficulty in finding skilled labor and are reluctant to cut any jobs. Continuing claims, which counts the number of people already receiving benefits, declined by 20,000 to 1.71 million. Thomas Simons, senior money market economist at Jefferies LLC noted, “Current claims levels continue to reflect a labor market that is very tight.”
Home price growth remained positive but retreated from its rapid growth of earlier this year, according to the latest reading from S&P/Case-Shiller. The S&P/Case-Shiller national home price index rose a seasonally adjusted 0.3% in June, up 6.2% for the year, while the more narrowly focused 20-city index added 0.1%, a 6.3% annual gain. Economists and housing market analysts have stated that prices couldn’t continue their earlier rate of growth, and it appears the market finally got the message. Both growth rates are still double the rate of inflation and wage gains, but a step in the right direction for bringing house prices back into the range of more buyers. In the details, the West continues to be the best with Las Vegas leading the way, followed by Seattle and San Francisco. New York, which has been hit by recent tax-law changes, was the only metro area to decline in June.
The number of home sales in which a contract has been signed but not yet closed declined by 0.7% in July according to the National Association of Realtors (NAR). The NAR’s pending home sales index fell -0.7% to 106.2—missing forecasts of a flat reading. On an annualized basis, the index was down -2.3% from the same time last year. It was the seventh consecutive month in which the index was lower on a year-over-year basis. By region, pending home sales rose 1% in the Northeast and 0.3% in the Midwest, but fell in the South by -1.7% and in the West by -0.9%. The NAR’s pending home sales data is often used by analysts as an early read on the existing-home sales report, since contract signings precede closings by several week. Based on the data, Chief Economist Sam Khater at Freddie Mac noted, “It appears sales activity crested in late 2017, it is clear affordability constraints have cooled the housing market, especially in expensive coastal markets.”
Americans’ confidence in the economy soared to an 18-year high, hitting levels last seen during the dot.com boom, reflecting the surging growth in the economy and the lowest unemployment rate in almost two decades. The Conference Board reported its Consumer Confidence index jumped 5.5 points to 133.4 in August, the highest level since October of 2000. Americans were confident about both the present and the future. A measure of current conditions, the present situation index, climbed to 172.2 from 166.1, while the future expectations index advanced to 107.6 from 102.4. Lynn Franco, director of economic indicators at the Conference Board, stated “Overall, these historically high confidence levels should continue to support healthy consumer spending in the near-term.”
The nation’s consumers continued spending in July. The government reported consumer spending rose sharply in July for the fifth month in a row as the economy got off to a good start for the third quarter. Consumer spending rose 0.4% in July, while incomes rose 0.3%. However, the good news comes with a cost. Higher spending and faster economic growth have also fueled inflation with the Personal Consumption Expenditures (PCE) Index, the Federal Reserve’s preferred inflation gauge, rising to an annualized 2.3% from 2.2% in July – its highest level since April 2012. In addition, the yearly increase in core PCE, which strips out the volatile food and energy categories, hit 2% for the first time since March and only the second time since 2012. The increase in prices gives the Federal Reserve the green light for another interest rate increase at the end of September.
Sentiment among the nation’s consumers retreated from lofty levels last month according to the latest reading from the University of Michigan. UMich’s Consumer Sentiment index was 96.2 in August, down 1.7 points from July’s reading. Still, that was higher than the 95.5 expected by economists. In the details, most of the pullback was due to a decline in the current economic conditions index, which fell to its lowest level in almost two years. The causes for the decline were a less-favorable assessment of buying conditions as prices and interest rates continued to rise. Inflation expectations for the next year rose to 3% while expectations for the next five years hit 2.6%, the highest level in four years. Still, sentiment is trending higher and economists aren’t expecting a slowdown in consumer spending.
It turns out the stellar U.S. economic growth in the second quarter was even stronger than originally reported. Gross Domestic Product (GDP) was revised up an additional 0.1% to 4.2%, thanks to higher government spending and business investment. Economists had expected GDP to remain unchanged. The strong growth, along with the biggest tax cuts in 31 years helped corporations cash in their biggest 12-month gain in four years. Adjusted corporate profits before taxes climbed 3.3% in the second quarter, up an impressive 7.7% over the past year. Jim Baird, chief investment officer at Plante Moran Financial Advisors stated, “The bottom line is that the economy remains on a solid growth path and still appears to have the potential to remain on a positive track for some time to come.”
International Economic News: Considering that three-quarters of Canada’s exports go to the U.S., it is up to Canada to decide whether it wants to make a deal with the United States or have a smaller economy. Trade negotiations between the White House and Canadian leaders fell apart on Friday after an impasse over dairy products were further inflamed by comments by U.S. President Trump suggesting that he would refuse to offer Canada any concessions. Canadian Foreign Minister Chrystia Freeland said that her government would not sign on to an agreement unless it was good for Canadians. “My job is to ensure this agreement works for Canadian workers, Canadian families and Canadian businesses,” she said. The trade talks are to resume Wednesday, with U.S. and Canadian negotiators saying they would still seek consensus.
The Bank of England (BoE) reported lending in the U.K. economy is down, suggesting that consumers are becoming more cautious. The BoE reported new consumer credit lines stood at 0.817 billion pounds in July, down from 1.521 billion pounds in June, well below economists’ forecasts of 1.50 billion pounds. Net lending to individuals came in at just 4.0 billion pounds, well below the 5.4 billion pounds reported in June. With U.K. wage growth stagnant, the figures hint at the potential for lower rates of retail sales and economic performance over the coming months. Along with consumer spending, the housing market may also be slowing. Mortgage approvals for July stood at 64.77k, down from the 65.37k reported in June and below consensus forecasts for 65k.
French Prime Minister Edouard Philippe said France’s budget for next year will be based on an economic growth forecast of 1.7% and a public deficit target that may be hard to reach. The budget outlined a plan for job cuts and lower public spending. Phillipe told the Journal du Dimanche, “We stand by our policy to transform (France) and to rein in spending, while bolstering spending that will support economic activity. It’s a break with policies that were a blind increase in all benefits.” The euro-area’s second-largest economy continues to lag the growth of both neighboring Germany and the European Union as a whole. Consumer spending is forecast to grow just 0.2% in the second quarter, and the unemployment rate remains a slight 0.3% lower than when President Emmanuel Macron took office.
Europe’s largest economy will likely record the world’s largest trade surplus three years running, according to German financial research institute CES. CES predicts Germany will end the year with a trade surplus of $299 billion. Germany’s economy is growing in other areas as well. The Bundesbank reported the country’s second quarter growth rate was regaining momentum and should remain stable despite trade tensions. The economy grew by a healthy half-percent over that quarter. The German government reported a $56 billion revenue surplus in the first six months of 2018, according to Germany’s national statistics office, Destatis.
Stock prices in the world’s second-largest economy are indicating that China is in bad shape, but steel prices are telling a very different story. The Nanhua rebar steel futures index is up 22% this year, while China’s Shanghai Composite is off over 16%. Larry Hu, head of greater China economics notes steel prices reflect the current state of the real economy while stocks represent market sentiment on the outlook for growth. Stock investors have worried about slowing economic growth as Beijing tries to reduce the country’s reliance on debt, but the resilience of the nation’s steel market shows the real economy is actually quite healthy. Despite China’s slow transition from a manufacturing-driven economy to a consumption-based one, the steel industry is closely watched because it is a huge part of China’s manufacturing base. Chinese industry giant Baosteel announced that profits in the first half of the year rose 62.2% year-over-year to 10.01 billion yuan ($1.47 billion).
Amid concerns over a trade war with the United States, Japan and China agreed to bolster economic cooperation between the two countries. The Finance Minister of Japan, Taro Aso, said the economies of both countries are “in an important phase” at the outset of a meeting with his Chinese counterpart Liu Kin. Officials from the finance ministries and central banks of the two neighbors also joined the China-Japan Finance Dialogue. During the meetings, Japan and China voiced agreement that trade protectionism will not benefit any country. Aso said Tokyo and Beijing are making efforts to “achieve tangible results” for an envisioned summit in October between Prime Minister Shinzo Abe and Chinese President Xi Jinping.
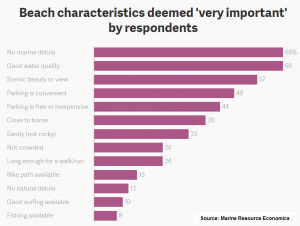
Finally: As summer unofficially comes to an end this Labor Day weekend (summer doesn’t officially come to an end until September 22), most families have already wrapped up their summer beach vacations. But what exactly defines a good beach? In a survey of Americans of what is “very important” when considering a nice beach, ‘no marine debris’ and ‘good water quality’ led the rankings with ‘scenic beauty or view’ closely behind. At the bottom of the list, respondents appear not to care whether fishing or surfing was available.
(sources: all index return data from Yahoo Finance; Reuters, Barron’s, Wall St Journal, Bloomberg.com, ft.com, guggenheimpartners.com, zerohedge.com, ritholtz.com, markit.com, financialpost.com, Eurostat, Statistics Canada, Yahoo! Finance, stocksandnews.com, marketwatch.com, wantchinatimes.com, BBC, 361capital.com, pensionpartners.com, cnbc.com, FactSet; Figs 1-5 source W E Sherman & Co, LLC)
These are the opinions of WE Sherman and Co and not necessarily those of Cambridge, are for informational purposes only, and should not be construed or acted upon as individualized investment advice.
Securities offered through Registered Representatives of Cambridge Investment Research Inc., a broker-dealer, member FINRA/SIPC. Advisory Services offered through Cambridge Investment Research Advisors, a Registered Investment Adviser. Strategic Investment Partners and Cambridge are not affiliated.
Indices mentioned are unmanaged and cannot be invested into directly. Past performance is no guarantee of future results. All Investing involves risk. Depending on the types of investments, there may be varying degrees of risk. Investors should be prepared to bear loss, including total loss of principal.