
9-10-2018 Weekly Market Update
The very big picture:
In the “decades” timeframe, the current Secular Bull Market could turn out to be among the shorter Secular Bull markets on record. This is because of the long-term valuation of the market which, after only eight years, has reached the upper end of its normal range.
The long-term valuation of the market is commonly measured by the Cyclically Adjusted Price to Earnings ratio, or “CAPE”, which smooths out shorter-term earnings swings in order to get a longer-term assessment of market valuation. A CAPE level of 30 is considered to be the upper end of the normal range, and the level at which further PE-ratio expansion comes to a halt (meaning that increases in market prices only occur in a general response to earnings increases, instead of rising “just because”).
Of course, a “mania” could come along and drive prices higher – much higher, even – and for some years to come. Manias occur when valuation no longer seems to matter, and caution is thrown completely to the wind as buyers rush in to buy first and ask questions later. Two manias in the last century – the 1920’s “Roaring Twenties” and the 1990’s “Tech Bubble” – show that the sky is the limit when common sense is overcome by a blind desire to buy. But, of course, the piper must be paid and the following decade or two are spent in Secular Bear Markets, giving most or all of the mania gains back.

See Fig. 1 for the 100-year view of Secular Bulls and Bears. The CAPE is now at 33.00, down from the prior week’s 33.33, and exceeds the level reached at the pre-crash high in October, 2007. This value is in the lower end of the “mania” range. Since 1881, the average annual return for all ten year periods that began with a CAPE around this level have been in the 0% – 3%/yr. range. (see Fig. 2).

In the big picture:
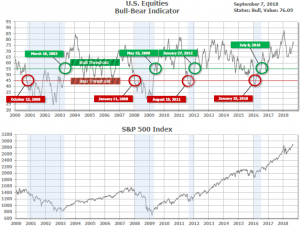
The “big picture” is the months-to-years timeframe – the timeframe in which Cyclical Bulls and Bears operate. The U.S. Bull-Bear Indicator (see Fig. 3) is in Cyclical Bull territory at 76.09, down from the prior week’s 78.22.
In the intermediate and Shorter-term picture:
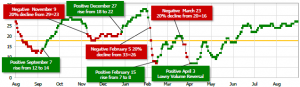
The Shorter-term (weeks to months) Indicator (see Fig. 4) turned positive on April 3rd. The indicator ended the week at 26, down from the prior week’s 27. Separately, the Intermediate-term Quarterly Trend Indicator – based on domestic and international stock trend status at the start of each quarter – was positive entering July, indicating positive prospects for equities in the third quarter of 2018.
Timeframe summary:
In the Secular (years to decades) timeframe (Figs. 1 & 2), the long-term valuation of the market is simply too high to sustain rip-roaring multi-year returns – but the market has entered the low end of the “mania” range, and all bets are off in a mania. The only thing certain in a mania is that it will end badly…someday. The Bull-Bear Indicator (months to years) is positive (Fig. 3), indicating a potential uptrend in the longer timeframe. In the intermediate timeframe, the Quarterly Trend Indicator (months to quarters) is positive for Q3, and the shorter (weeks to months) timeframe (Fig. 4) is positive. Therefore, with all three indicators positive, the U.S. equity markets are rated as Positive.
In the markets:
U.S. Markets: U.S. stocks retreated from last week’s record highs in the holiday-shortened week, with global markets still on edge amid escalating global trade tensions. The Dow Jones Industrial Average ended the week down -0.2% to close at 25,916. The technology-heavy NASDAQ Composite retraced all of last week’s gain falling -2.6%, or 207 points, ending the week at 7,902. By market cap, mid caps were the relative outperformers falling just -0.9%, while the large cap S&P 500 gave up -1.0% and the small cap Russell 2000 declined -1.6%.
International Markets: Canada’s TSX declined for a second week, down -1.1%, while the United Kingdom’s FTSE followed last week’s -2% drop with a further -2.1% decline. On Europe’s mainland as well, markets finished the week deep in the red. France’s CAC 40 was off -2.9% and Germany’s DAX plunged -3.3%. In Asia, China’s Shanghai Composite was off -0.9%, Japan’s Nikkei declined -2.4%, and Hong Kong’s Hang Seng finished down ‑3.3%. As grouped by Morgan Stanley Capital International, developed markets finished the week down ‑2.8%, while emerging markets were off -3.8%.
Commodities: Energy took a break after back-to-back weekly gains with West Texas Intermediate crude oil falling ‑3% to $67.75 per barrel and Brent North Sea crude down ‑0.9% at $77.04 a barrel. Precious metals also finished the week lower. Gold gave up -0.5%, ending the week at $1200.40 an ounce and Silver closed down ‑2.6% to $14.07 an ounce. Copper, viewed by some analysts as an indicator of worldwide economic health due to its variety of industrial uses, finished the week down -1.8%.
U.S. Economic News: Initial claims for new unemployment benefits fell by 10,000 to 203,000 last week, touching their lowest level since December of 1969. The reading beat consensus estimates for a decline of just 2,000 to 211,000. The four week average of new claims, smoothed to iron out weekly volatility, declined by 2,750 to 209,500. That number is also at its lowest level since December of 1969. Overall, labor market analysts note that times are good. Companies have created more than 19 million new jobs in the past eight years to drive the unemployment rate down to 3.9% from a peak of 10%. In addition, companies are struggling to find skilled workers and they are reluctant to lay off experienced employees. The number of people already receiving unemployment benefits, so-called “continuing claims”, fell by 3,000 to 1.71 million.
Private sector payroll processor ADP reported the U.S. created a seasonally-adjusted 163,000 job in August, but missed expectations for 182,000 new jobs. The reading was down from the 217,000 private sector jobs created in July and its weakest increase since last October. In the details of the report, services payrolls rose 139,000 led by professional and business services, while goods-producing jobs rose by 24,000. Midsized companies did most of the hiring with 111,000 new jobs added. Although the headline number was down from last month, Neil Dutta of Renaissance Macroresearch noted “Considering how low the jobless rate is, this represents a reasonably solid pace of employment growth.”
The U.S. added 201,000 new jobs and unemployment remained at an 18-year low, according to the Labor Department’s monthly Non-Farm Payrolls (NFP) report. The reading exceeded economists’ expectations for an increase of 200,000 new nonfarm jobs. The increase in hiring last month was another solid gain reflecting broad strength in the economy. However, the biggest news from the report was a sharp increase in pay. The average wage paid to American workers rose by 10 cents to $27.16 an hour. The yearly rate of pay increases climbed to 2.9% from 2.7% marking their highest level since June 2009. In the details, white-collar professional firms added 53,000 positions, while health care providers hired 33,000 and transport firms added 20,000. Aside from a shortage of skilled labor, companies say their biggest problem is coping with a spate of higher U.S. and foreign tariffs that have raised the cost of key materials such as steel and lumber and made it harder to obtain supplies.
The Commerce Department reported spending on construction projects rose 0.1% in July, led by the public sector. Public construction spending surged 0.7% while private sector spending slipped 0.1%. Over the past year, construction spending has risen 5.8%. Overall, despite the volatile data the overarching trend in construction spending is up. Through the first seven months of the year, expenditures were 5.2% higher than in the same period in 2017. However, some economists, like Ian Shepherdson at Pantheon Macroeconomics weren’t impressed, calling the reading “…disappointing. For now it appears that construction activity is softening after a very strong first half.”
American manufacturers are on a roll, according to the Institute for Supply Management (ISM). ISM’s manufacturing index jumped to a 14-year high of 61.3 in August, up 3.2 points from July. It was the biggest monthly gain since March 2010 and its highest reading since May of 2004. Economists had expected a drop to 57.9. In the details of the report, all of the ISM’s individual components advanced. The new-orders index climbed 3.2 points to 65.1 while the employment gauge added 2 points to 58.5. Sixteen of the eighteen industries tracked by ISM reported expansion last month, indicating a broad-based expansion. The ISM index is compiled from a survey of executives who order raw materials and other supplies for their companies.
ISM’s survey of services companies also showed rapid growth last month. ISM’s non-manufacturing index rebounded 2.8 points to 58.5 as services activity strengthened. It was the biggest gain since January, and reversed most of the steep decline the previous month. All four of the services index components (new orders, business activity, employment, and supplier deliveries) rose last month, led by a 4.2 point rebound in the business activity index—the most since September 2016. Chief U.S. economist Jim O’Sullivan of High Frequency Economics noted the ISM report was “quite strong, despite ongoing concerns about trade policy.”
So far the imposition of U.S. tariffs on a variety of foreign goods has done nothing to curb the trade deficit. The trade deficit surged $4.3 billion in July to $50.1 billion—its biggest gap since February. The increase in July was the biggest since March 2015 as the strong domestic economy fueled demand for imports, helped by an especially strong U.S. dollar. These two factors appeared to have overwhelmed the dampening effect of the recently enacted U.S. tariffs. Imports climbed 0.9% in July, the most in five months, due to gains in food, vehicles, capital goods ex-autos (predominantly computers and computer accessories) and other merchandise. Exports fell 1%, with the most notable drop being a 6.3% plummet in food exports as China’s retaliatory tariffs hit soybeans and other farm products.
International Economic News: The Bank of Canada took a break from its rate hike cycle at its meeting this week as it braces for the fallout from the country’s trade showdown with the United States. The central bank opted to leave its key interest rate at 1.5% in spite of unexpectedly good economic news this summer. In its statement, the bank said, “The bank is . . . monitoring closely the course of NAFTA negotiations and other trade policy developments, and their impact on the inflation outlook” adding that “elevated trade tensions” remain a key risk to the global economy and are already weighing on some commodity prices. Negotiators from the U.S. and Canada met again this week to resume talks aimed at renegotiating the North American Free Trade Agreement. Key issues continue to separate the two countries including Canada’s dairy market, and Ottawa’s insistence on retaining an independent dispute settlement system.
According to a report from the Britain’s left-leaning Institute for Public Policy Research (IPPR), the United Kingdom’s economy requires a “fundamental structural shift”. The report specifically mentions giving workers more rights, raising state investment, and empowering regulators to break up monopolies as key reforms. The IPPR states the overhaul is needed to address the U.K. chronic failure to raise the standard of living of millions of workers since the 2008 financial crash. The report argues that the shareholder-driven model of capitalism is outmoded and partly to blame for Britain dropping down international league tables for investment and productivity. The IPPR commission on economic justice includes the Archbishop of Canterbury Justin Welby, senior business leaders, and economists.
European Union Economic and Monetary Affairs Commissioner Pierre Moscovici warned that France must keep its public sector budget from breaking through an EU ceiling if Paris wants to retain its fiscal credibility. President Emmanuel Macron’s government is in the process of drafting next year’s budget and has said the deficit is likely to be between 2.6% and 3.0% of economic output. “It’s very important that the France does not overshoot the 3 percent limit in 2019,” Moscovici, himself a Socialist former French finance minister, told l’Opinion newspaper. France brought its deficit under the 3% limit last year for the first time in a decade, boosting its credibility with its EU partners.
Industrial production in Germany stumbled in July as global trade war fears continued to weigh and bottlenecks in the German auto sector caused by new environmental standards. German federal statistics authority Destatis reported German factory output fell 1.1% in July, missing estimates of a 0.2% increase. Production was lower across German manufacturing firms with capital goods makers off 2.5%, producer goods makers down 1.4%, and consumer goods makers down 0.9%. Construction output was the only sector to report an increase. In addition, the Federal Statistics Office reported German exports fell a seasonally-adjusted 0.9% for the month of August, while imports surged 2.8%–their strongest rise in almost four years.
President Trump threatened China with an additional $267 billion of tariffs on Chinese imports, on top of the proposed $200 billion that his administration is in the process of finalizing. President Trump stated the implementation of $200 billion worth of tariffs on products from China “will take place very soon depending on what happens.” Furthermore, he surprised reporters stating, “I hate to do this, but behind that there is another $267 billion ready to go on short notice if I want.” Trump latest tariffs threats, if he follows through, would more than cover the value of all goods the U.S. buys from China, according to U.S. government data from last year. The U.S. imported $505 billion of Chinese products in 2017, Census Bureau figures show.
Government ministries in Japan requested a record 102.8 trillion yen ($930 billion) in the budget for the fiscal year starting next April as Prime Minister Shinzo Abe seeks to get the country ready for higher welfare costs, natural disasters, and possible threats from North Korea. The Infrastructure and Transport ministry is seeking the most aggressive increases, requesting a 19% increase to fund infrastructure improvements to cope with natural disasters such as typhoons, torrential rains, and earthquakes. The Defense Ministry is seeking a 2.1% increase to 5.3 trillion yen so it can buy new ground-based Aegis Ashore radar missile tracking stations to deal with ballistic missile threats from North Korea. The Abe government continues to prioritize economic growth over fiscal consolidation despite the nation’s mounting debt.
Finally: Nine years into the current bull market more and more are beginning to wonder “how much longer can it go on?” Tony Dwyer, equity strategist at Canaccord Genuity, reiterated his S&P 500 target of 3,200 for the end of this year (a nearly 11% rise from current levels), based on the strong manufacturing report this week. Dwyer went further and projected the index to rise to 3,360 in 2019, highlighting his view that a recession isn’t lurking “anywhere close”. He wrote “The Institute for Supply Management (ISM) showed that the manufacturing sector remains on very solid ground. History shows that since 1950, the ISM typically peaks well before the economy enters recession or the S&P 500 hits the cycle high, especially over the past three levered economic periods.” Dwyer notes that on average the Institute for Supply Management’s manufacturing reading peaked a median 31.5 months before the start of a recession, and that the S&P 500 usually gains about 35.4% in the subsequent two years following the peak. While there are a couple of exceptions to his rule, Dwyer notes that the inflation and interest rate environments then were quite different from the current situation. (chart from Canaccord Genuity)

(sources: all index return data from Yahoo Finance; Reuters, Barron’s, Wall St Journal, Bloomberg.com, ft.com, guggenheimpartners.com, zerohedge.com, ritholtz.com, markit.com, financialpost.com, Eurostat, Statistics Canada, Yahoo! Finance, stocksandnews.com, marketwatch.com, wantchinatimes.com, BBC, 361capital.com, pensionpartners.com, cnbc.com, FactSet; Figs 1-5 source W E Sherman & Co, LLC)
These are the opinions of WE Sherman and Co and not necessarily those of Cambridge, are for informational purposes only, and should not be construed or acted upon as individualized investment advice.
Securities offered through Registered Representatives of Cambridge Investment Research Inc., a broker-dealer, member FINRA/SIPC. Advisory Services offered through Cambridge Investment Research Advisors, a Registered Investment Adviser. Strategic Investment Partners and Cambridge are not affiliated.
Indices mentioned are unmanaged and cannot be invested into directly. Past performance is no guarantee of future results. All Investing involves risk. Depending on the types of investments, there may be varying degrees of risk. Investors should be prepared to bear loss, including total loss of principal.