
9-26-2022 Weekly Market Update
The very Big Picture
The long-term valuation of the market is commonly measured by the Cyclically Adjusted Price to Earnings ratio, or “CAPE”, which smooths-out shorter-term earnings swings in order to get a longer-term assessment of market valuation. A CAPE level of 30 is considered to be the upper end of the normal range, and the level at which further PE-ratio expansion comes to a halt (meaning that further increases in market prices only occur as a general response to earnings increases, instead of rising “just because”). The market is now above that level.
Of course, a “mania” could come along and drive prices higher – much higher, even – and for some years to come. Manias occur when valuation no longer seems to matter, and caution is thrown completely to the wind – as buyers rush in to buy first, and ask questions later. Two manias in the last century – the “Roaring Twenties” of the 1920s, and the “Tech Bubble” of the late 1990s – show that the sky is the limit when common sense is overcome by a blind desire to buy. But, of course, the piper must be paid, and the following decade or two were spent in Secular Bear Markets, giving most or all of the mania-gains back.
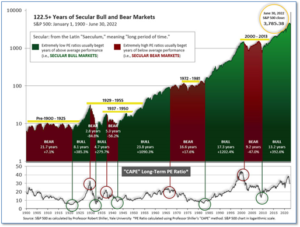
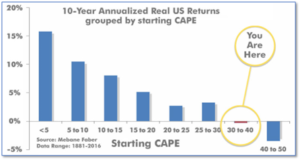
See Fig. 1 for the 100-year view of Secular Bulls and Bears. The CAPE is now at 27.65, down from the prior week’s 28.99. Since 1881, the average annual return for all ten-year periods that began with a CAPE in this range has been slightly positive to slightly negative (see Fig. 2).
Note: We do not use CAPE as an official input into our methods. However, if history is any guide – and history is typically ‘some’ kind of guide – it’s always good to simply know where we are on the historic continuum, where that may lead, and what sort of expectations one may wish to hold in order to craft an investment strategy that works in any market ‘season’ … whether the current one, or one that may be ‘coming soon’!
The Big Picture:
The ‘big picture’ is the (typically) years-long timeframe – the timeframe in which Cyclical Bulls and Bears operate. The U.S. Bull-Bear Indicator finished the week in Bear territory at 38.15, down from the prior week’s 40.36.

In the Quarterly- and Shorter-term Pictures
The Quarterly-Trend Indicator based on the combination of U.S. and International Equities trend-statuses at the start of each quarter – was Negative entering July, indicating negative prospects for equities in the third quarter of 2022.
Next, the short-term(weeks to months) Indicator for US Equities turned negative on August 29, and ended the week at 3, down from the prior week’s 11.
In the Markets:
U.S. Markets: Stocks recorded a second week of large losses after Federal Reserve policymakers revealed they expected official short-term interest rates to continue going sharply higher for longer than market participants have been expecting. The Dow Jones Industrial Average and S&P 400 Midcap Index fell to new intraday lows since late 2020, while the S&P 500 Index, small-cap Russell 2000 Index, and Nasdaq Composite managed to stay slightly above their bottoms in mid-June 2022. The Dow Jones Industrial Average shed over 1200 points falling -4% to 29,590. The technology-heavy NASDAQ Composite gave up -5.1% to 10,868. By market cap, the large cap S&P 500 ended down ‑4.6%, while the mid cap S&P 400 declined -5.9%. Small cap stocks fared the worst, with the Russell 2000 plunging ‑6.6%.
International Markets: Major international markets were also a sea of red. Canada’s TSX declined -4.7%, while the United Kingdom’s FTSE 100 gave up -3.0%. France’s CAC 40 and Germany’s DAX declined -4.8% and -3.6% respectively, while in Asia, China’s Shanghai Composite finished down -1.2%. Japan’s Nikkei closed down -1.5%. As grouped by Morgan Stanley Capital International, developed markets plunged -6% last week and emerging markets ended down -4.8%.
Commodities: Major commodities were all down for the week. Gold and silver only provided a small degree of safety to nervous investors. Gold declined -1.7% to $1655.60 while Silver retreated -2.4% to $18.91. Crude oil was sold with West Texas Intermediate crude falling -7.1% to $78.74 per barrel, while Brent crude retreated -5.3% to $86.75. Copper, viewed by some analysts as a barometer of world economic health due to its wide variety of industrial uses, finished the week down -4.9%.
U.S. Economic News: The number of Americans filing for first-time unemployment benefits edged up last week, but overall the labor market remains strong with few layoffs. The Labor Department reported initial jobless claims last week rose by 5,000 to 213,000. Economists had forecast new claims to total 214,000. Part of the central bank’s goal in its fight against inflation is to cool off a red-hot labor market in which wages are rising sharply and adding to inflation. If the Fed succeeds, hiring is expected to slow, layoffs will rise and the unemployment rate would increase from its current 3.7% rate.
The National Association of Home Builders (NAHB) says the recession in housing “shows no signs of abating”, according to its latest report. The NAHB’s monthly confidence index fell 3 points to 46 in September. It was the index’s ninth consecutive month of declines, and excluding the pandemic, its lowest reading since May of 2014. The index stood at 76 the same time last year. In the details, all 3 sub-indexes that make up the headline index fell. The gauge that marks current sales conditions fell by 3 points, while the component that measures buyer traffic fell 1 point. The gauge that assesses sales expectations for the next 6 months fell by 1 point, as well. All four NAHB regions posted drops in builder confidence. Declines were led by the West, which saw a 10-point drop, followed by the South, with a 7-point drop. The Northeast and the Midwest each saw a 5-point drop. “Builder sentiment has declined every month in 2022, and the housing recession shows no signs of abating,” said Robert Dietz, the NAHB’s chief economist.
Sales of existing homes fell for a seventh consecutive month in August, according to the National Association of Realtors (NAR). The NAR reported existing-home sales fell -0.4% to a seasonally-adjusted annual rate of 4.8 million in August. The reading exceeded forecasts for a slightly steeper decline to 4.68 million. This is the lowest level of existing home sales since May 2020, shortly after the pandemic began. Excluding the recession, the level of sales activity was its lowest since November 2015. Compared with the same time last year, home sales were down -19.9%. The slowing sales activity is bringing prices down. The median price for an existing home fell to $389,500, down from a peak of $413,800 reached in June. Expressed in terms of the months-supply metric, there was a 3.2-month supply of homes for sale in August, up from 2.6 months in August. A six month supply of homes is generally considered a ‘balanced’ housing market.
Construction on new U.S. housing rose in August, the government reported, but activity was primarily focused on multi-family dwellings such as apartments and condominiums. The Commerce Department reported home construction rose a seasonally-adjusted 12.2% in August to 1.58 million units. The rise reversed a steep fall in July, where housing starts fell a revised -10.9%. Economists had expected starts to rise to 1.5 million. In the details, apartment construction rose 28.6%, while the construction pace of single-family homes rose just 3.4%. Furthermore, home ownership affordability is at its lowest level since the Atlanta Fed began monitoring the data in 2006. The median sales price for a new home was $439,400 in July, according to the U.S. Census Bureau. In addition, in a foreboding sign of future building activity, permits fell by 10% signaling a drop in future projects.
The Federal Reserve announced this week it was willing to tolerate a recession in order to restore ‘price stability’. The Federal Reserve voted to raise its benchmark interest rate by 0.75%—its third unusually large rate-hike in a row. According to the Fed’s forecast, the unemployment rate will rise to 4.4% next year. That’s 0.7% higher than the current unemployment rate. Powell said that “no one knows whether this process will lead to a recession, or, if so, how significant that recession would be,” he said. While the Fed raised its “terminal rate,” to 4.6% in 2023, no Fed officials forecast that rates would top 5%. In regard to housing prices, Powell said the recent deceleration in home prices from the “red-hot” market was a “good thing” because it brings prices more closely in line with rents and other fundamentals. Powell pledged to continue working to rein in inflation “until the job was done”.
U.S. companies reported business activity rebounded in September largely due to a pickup in new customer orders, but high inflation and continued supply and labor shortages posed obstacles to future growth. S&P Global reported its preliminary “flash” survey of U.S. manufacturing companies edged up 0.3 point to 51.8 this month, while its survey of services companies climbed 5.5 points to 49.2. It was the first increase in the services index in six months. New orders, a sign of future sales, rebounded in September for both manufacturers and service-oriented companies such as retailers. Chris Williamson, chief business economist at S&P Global Market Intelligence stated, “The surveys continue to paint a broad picture of an economy struggling in a stagflationary environment.”
International Economic News: Bank of Canada deputy governor Paul Beaudry said in hindsight that governments and central banks should have withdrawn stimulus measures earlier as economies recovered from the COVID-19 pandemic. In a speech at the University of Waterloo, Beaudry said a faster global withdrawal of fiscal and monetary stimulus during the recovery from the pandemic would have likely resulted in lower inflation. At the same time, Beaudry said the stimulus measures contributed to a faster-than-expected bounceback for the economy, with labor markets recovering six months sooner than after the global financial crisis. “Fiscal policy measures clearly prevented a worse outcome,” he concluded.
Across the Atlantic, the United Kingdom announced a sweeping program of tax cuts and investment incentives as Prime Minister Liz Truss seeks to reverse the country’s slowing economic growth. The measures include the cancellation of a planned rise in corporation tax to 25% and a reversal in the recent 1.25% rise in National Insurance contributions—a tax on income. Speaking to the House of Commons, Finance Minister Kwasi Kwarteng said, “We believe high taxes reduce incentives to work, deter investment and hinder enterprise.” He added the government wanted a “new approach for a new era focused on growth” and was targeting a medium-term 2.5% trend rate in economic growth.
On Europe’s mainland, the business climate in France deteriorated again this month, dropping two points to 102. Although still above its long-term average, the business climate has erased all its post-pandemic gains and is now equal to its April 2021 level. All major sectors of activity are participating in this deterioration, except for construction. Notably, the sectors that benefited most from the post-Covid rebound this summer, especially accommodation and catering, are the ones that feel that the outlook has deteriorated the most for the coming months. In all sectors, the perceived economic uncertainty has increased. Given the developments of the last few weeks, it is feared that French GDP growth will move into negative territory in the third quarter.
In Europe’s economic powerhouse, Germany, a downturn in business activity deepened this month according to a preliminary survey. S&P Global’s flash composite Purchasing Managers’ Index (PMI), which tracks both the manufacturing and services sectors fell to 45.9 in September from August’s final reading of 46.9. Analysts were expecting a reading of 46.0. September marks the third month in a row that the reading fell below the 50 mark that separates growth from contraction, as well as the lowest figure, if confirmed in a final reading, since May 2020. Phil Smith, economics associate director at S&P Global Market Intelligence stated, “The German economy looks set to contract in the third quarter, and with PMI showing the downturn gathering speed in September and the survey’s forward-looking indicators also deteriorating, the prospects for the fourth quarter are not looking good either.”
In Asia, investment bank Goldman Sachs slashed its 2023 economic growth forecast for China, predicting Beijing will stick to its stringent zero-Covid policies through at least the first quarter of next year. Gross Domestic Product will probably increase 4.5% in 2023, down from a previous projection of 5.3%, Goldman’s economists led by Hui Shan wrote in a note. This year’s prediction of 3% was maintained. Goldman believes China is unlikely to begin reopening before the second quarter of next year as it tries to put several steps in place first, such as higher vaccination rates for elderly and increased manufacturing of cheap and effective anti-Covid pills.
For the first time since 1998, Japan’s government intervened to prop up its currency, the yen. Masato Kanda, the country’s top currency official, said the government had “taken decisive action” to address what it warned was a “rapid and one-sided” move in the foreign exchange market. It was the first time Japan had sold dollars since 1998, according to government data. Finance minister Shunichi Suzuki declined to comment on the scale of the intervention. So far this year, the yen has lost about a fifth of its value against the dollar. Japan is now the only country in the world to retain negative interest rates as the US Federal Reserve and most other major central banks aggressively raise interest rates to fight inflation.
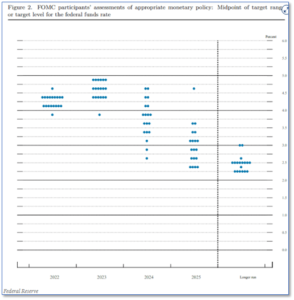
Finally: In a widely-anticipated move, the Federal Reserve hiked interest rates 75 basis points this week. Despite the move being widely expected, financial markets plunged the remainder of the week. So what was the catalyst? Analysts point to the Federal Reserve’s “dot plot”—a graph of the projections of each member of the Federal Open Market Committee (FOMC) of their most likely outcome for GDP, the unemployment rate, and inflation. Comments from Fed Chair Jerome Powell and the “dot plot” showed the Fed is expected to raise rates at least 125 basis points in its two remaining meetings this year, and the dot plot showed no rate cuts were anticipated until at least 2024. Bill Zox, portfolio manager at Brandywine Global, in reference to the size of the rate hikes stated, “The Fed is not anywhere close to a pause or a pivot. They are laser-focused on breaking inflation. A key question is: what else might they break?” (Chart from the Federal Reserve)
(Sources: All index- and returns-data from Yahoo Finance; news from Reuters, Barron’s, Wall St. Journal, Bloomberg.com, ft.com, guggenheimpartners.com, zerohedge.com, ritholtz.com, markit.com, financialpost.com, Eurostat,0020Statistics Canada, Yahoo! Finance, stocksandnews.com, marketwatch.com, wantchinatimes.com, BBC, 361capital.com, pensionpartners.com, cnbc.com, FactSet.) Content provided by WE Sherman and Company. Securities offered through Registered Representatives of Cambridge Investment Research Inc., a broker-dealer, member FINRA/SIPC. Advisory Services offered through Cambridge Investment Research Advisors, a Registered Investment Adviser. Strategic Investment Partners and Cambridge are not affiliated. Indices mentioned are unmanaged and cannot be invested into directly. Past performance is no guarantee of future results. These opinions of Strategic Investment Partners and not necessarily those of Cambridge Investment Research, are for informational purposes only and should not be construed or acted upon as individualized investment advice.