
9-19-2022 Weekly Market Update
The very Big Picture
The long-term valuation of the market is commonly measured by the Cyclically Adjusted Price to Earnings ratio, or “CAPE”, which smooths-out shorter-term earnings swings in order to get a longer-term assessment of market valuation. A CAPE level of 30 is considered to be the upper end of the normal range, and the level at which further PE-ratio expansion comes to a halt (meaning that further increases in market prices only occur as a general response to earnings increases, instead of rising “just because”). The market is now above that level.
Of course, a “mania” could come along and drive prices higher – much higher, even – and for some years to come. Manias occur when valuation no longer seems to matter, and caution is thrown completely to the wind – as buyers rush in to buy first, and ask questions later. Two manias in the last century – the “Roaring Twenties” of the 1920s, and the “Tech Bubble” of the late 1990s – show that the sky is the limit when common sense is overcome by a blind desire to buy. But, of course, the piper must be paid, and the following decade or two were spent in Secular Bear Markets, giving most or all of the mania-gains back.
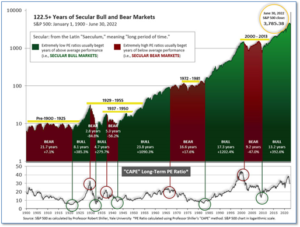
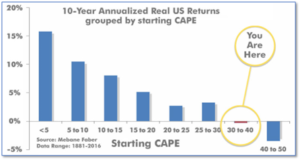
See Fig. 1 for the 100-year view of Secular Bulls and Bears. The CAPE is now at 28.99, down from the prior week’s 30.43. Since 1881, the average annual return for all ten-year periods that began with a CAPE in this range has been slightly positive to slightly negative (see Fig. 2).
Note: We do not use CAPE as an official input into our methods. However, if history is any guide – and history is typically ‘some’ kind of guide – it’s always good to simply know where we are on the historic continuum, where that may lead, and what sort of expectations one may wish to hold in order to craft an investment strategy that works in any market ‘season’ … whether the current one, or one that may be ‘coming soon’!
The Big Picture:
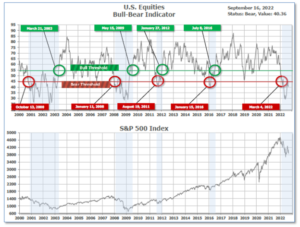
The ‘big picture’ is the (typically) years-long timeframe – the timeframe in which Cyclical Bulls and Bears operate. The U.S. Bull-Bear Indicator finished the week in Bear territory at 40.36, down from the prior week’s 41.79.
In the Quarterly- and Shorter-term Pictures
The Quarterly-Trend Indicator based on the combination of U.S. and International Equities trend-statuses at the start of each quarter – was Negative entering July, indicating negative prospects for equities in the third quarter of 2022.
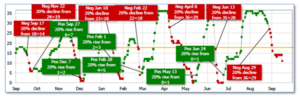
Next, the short-term(weeks to months) Indicator for US Equities turned negative on August 29, and ended the week at 11, down from the prior week’s 14.
In the Markets:
U.S. Markets: U.S. stocks fell sharply as inflation fears intensified and short-term bond yields reached their highest levels since 2007 (right before the onset of the Great Financial Crisis). The S&P 500 Index recorded its largest weekly drop since mid-June, hitting its lowest point on an intraday basis since mid-July. Growth stocks and tech fared the worst with the technology-heavy NASDAQ Composite falling 5.5% to 11,448. The Dow Jones Industrial Average shed over 1,300 points finishing at 30,822—a decline of 4.1%. By market cap, the large cap S&P 500 declined -4.8%, while the mid cap S&P 400 ended down -4.7% and the small cap Russell 2000 finished the week down -4.5%.
International Markets: International markets were a sea of red as well, but with losses not as deep as in the U.S. Canada’s TSX declined -2.0%, while the United Kingdom’s FTSE 100 ended down -1.6%. France’s CAC 40 and Germany’s DAX shed -2.2% and -2.7%, respectively, while in Asia, China’s Shanghai Composite finished down -4.2%. Japan’s Nikkei retraced all of last week’s rise closing down -2.3%. As grouped by Morgan Stanley Capital International, developed markets finished the week down -3.3% and emerging markets closed down -3.1%.
Commodities: The majority of commodities also finished the week to the downside. West Texas Intermediate crude pulled back -2.3% to $84.76 per barrel, while Brent crude gave up -1.4% to $91.57. Precious metals were mixed with Gold declining -2.6% to $1683.50 per ounce, while Silver rose 3.3% to $19.38. The industrial metal copper, viewed by some analysts as a barometer of world economic health due to its wide variety of uses, finished the week down -1.4%.
U.S. Economic News: The number of Americans filing for first-time unemployment benefits fell for a fifth consecutive week last week, remaining near historic lows. The Labor Department reported initial jobless claims fell by 5,000 to 213,000 in the week ending September 10. They are now at the lowest level since June. Economists had expected new claims to total 225,000. Rubeela Farooqi, chief U.S economist for High Frequency Economics, wrote in a note, “These timely data continue to signal that demand for labor is still strong, with layoffs declining, even as the Fed is tightening aggressively.” Meanwhile, the number of people already receiving benefits, known as “continuing claims”, rose by 2,000 to 1.4 million. That number remains near a 50-year low.
Confidence among the nation’s small business owners rose last month as expectations over business conditions in the short-term improved and inflation concerns moderated. The National Federation of Independent Business (NFIB), a small-business lobbying group, reported its Optimism Index rose 1.9 points to 91.8 in August. The reading beat the consensus forecast of 90.5. In the release, NFIB chief economist Bill Dunkelberg stated, “The small business economy is still recovering from the pandemic while inflation continues to be a serious problem for owners across the nation.” August marks a second consecutive month of gains for the index, which nonetheless remains low compared to historical standards. The overall improvement in confidence was driven by better prospects for short-term sales and the economy, improving from very depressed levels. The NFIB survey is a monthly snapshot of small businesses in the U.S., which account for nearly half of private sector jobs.
Despite falling gas prices, inflation rose slightly last month, but it was the breadth of that rise that worried investors. The Bureau of Labor Statistics reported its closely-watched Consumer Price Index (CPI) rose 0.1% in August. The reading exceeded expectations for a 0.1% drop. The small increase lowered the annual rate of inflation to 8.3% from 8.5%. However, in a more worrisome sign, the “core rate” of inflation that omits food an energy prices rose a sharp 0.6%–double the prior month’s increase. Wall Street had expected just a 0.3% gain. The increase in the core rate over the past year jumped to 6.3% from 5.9% underscoring how much inflation has become embedded in the economy. The Fed views the core rate as a more accurate measure of future inflation trends. Given the increase, the Fed is now widely expected to hike interest rates at least (another) three-quarters of a percentage point at its next meeting September 20th and 21st.
Costs at the wholesale level ticked down in August, largely due to cheaper gasoline. The Producer Price Index fell 0.1% last month, matching expectations and its first back-to-back drop since early 2020 when the pandemic began. On an annual basis, the increase in wholesale prices slowed to 8.7% from 9.8% in the prior month. However, like the consumer price index, omitting food and energy showed a 0.2% rise in core wholesale prices. That was higher than expected. Despite months of analysts and Fed officials stating inflation was “transitory”, almost everyone now agrees that inflation is pervasive and embedded and won’t be easy to eradicate.
Sales at the nation’s retailers rose a mild 0.3% in August as Americans spent more on new vehicles and eating out at restaurants. The reading suggests the economy grew at a steady (yet lackluster) pace toward the end of summer. However, analysts note that the amount of money Americans are spending largely reflects the higher prices being paid due to soaring inflation. Adjusted for inflation, retail spending has basically been flat for the past year. Now with summer in the rearview mirror and a Federal Reserve that is hiking interest rates, analysts are concerned consumers will be forced to cut their spending over the coming months. Economists at Oxford Economics wrote in a note, “Consumers continue to show resilience in the face of elevated inflation, and lower prices at the pump are a welcome relief. But the outlook in coming quarters is less favorable.”
Two regional gauges of manufacturing activity signaled contraction in September, according to data released this week. The Philadelphia Federal Reserve reported its manufacturing index slowed to -9.9 this month, down from 6.2 in the prior month. Economists had expected a reading of 2.3. In New York, the NY Fed’s Empire State Index managed a rebound to -1.5 from -31.3 but remained in contraction. Economists were expecting a reading of -13.8. In key subcomponents in the Philadelphia survey, new orders fell to -17.6 in September from -5.1 in the previous month. Shipments in Philadelphia fell to 8.8 from 24.8 in August. New orders in the New York region rebounded 33.3 points to 3.7 in September. Shipments soared 43.7 points to 19.6 in the region. The two regional Fed surveys are used by economists to gauge the strength of the national ISM factory index, which will be released the first week of October.
International Economic News: The coming economic downturn in Canada will be “moderate” by historical standards according to economists at the Royal Bank of Canada (RBC). RBC analysts Claire Fan, Nathan Janzen, and Craig Wright wrote, “Labour markets remain exceptionally strong across most advanced economies with unemployment rates still around the lowest levels in decades.” RBC is anticipating a 1.7% increase in the Canadian unemployment rate over the next year and a half–a gain that it described as “relatively mild” compared to previous downturns. “Signs are that inflation pressures have peaked, at least in North America as global commodity prices fall from very high levels, supply chain disruptions ease and housing markets correct under the weight of rising mortgage costs,” RBC said.
Across the Atlantic, the Bank of England (BoE) is set to raise interest rates to fight inflation but Britain’s new finance minister is eyeing tax cuts, which could stoke inflation. The apparent opposite views of monetary and fiscal policy underscore the economic challenges for Britain, which has the highest inflation among the world’s developed economies. Ellie Henderson, an economist with Investec, said BoE Governor Andrew Bailey and his colleagues should “stick to their guns” on countering inflationary risks. “They will be cooling the economy at a time when the government, through its fiscal policy, is trying to stimulate demand,” Henderson said. “There is divergence in the policy path but at the end of the day the BoE is independent and their main goal is price stability.”
On Europe’s mainland, France is set to cap power and gas price increases for households at 15% next year, Prime Minister Elisabeth Borne announced. The caps will cost the country $16 billion USD and prevent household energy bills from more than doubling. The state will also persist with grants for the poorest, with a check of up to 200 euros for 12 million households. Borne said the new cap on gas prices would take effect in January, while the new electricity cap would follow a month later. “We are determined, just like at the beginning of the crises that we face, to act, adapt and protect the French people and our economy”, Borne said.
Europe’s economic powerhouse, Germany, announced it had taken control of three refineries owned by Russian oil giant Rosneft. Chancellor Olaf Scholz said his government had not taken the step lightly, but that “it was unavoidable”. “We have known for a long time that Russia is no longer a reliable energy supplier,” he said. “That’s why it’s important to do everything we can now to safeguard Germany’s energy supply.” The move is part of efforts by the government to protect the German economy from the effects of an EU-wide embargo on Russian crude, which comes into effect on January 1. The move on Rosneft is the latest in a string of measures by the German government to deal with the chaos caused by Russia’s war in Ukraine, which has driven European gas and electricity prices to record levels.
In Asia, the last reliable pillar of the world’s second-largest economy is warning of hard times ahead due to softer overseas markets. As China itself struggles with the pandemic, weak domestic consumption, and a property crisis, now its exporters are sounding the alarm. Trade data for China’s $18 trillion economy showed export growth came in well below expectations and slowed for a fourth consecutive month. Those alarms are echoing in workshops across eastern and southern China’s manufacturing hubs, in industries from machinery parts and textiles to high-tech home appliances, where businesses are scaling back as export orders dry up. Nie Wen, a Shanghai-based economist at Hwabao Trust stated, “It is very likely China’s exports will slow further or even contract in the coming months, as leading economic indicators point to a global growth slowdown or even recession.”
Japan ran its biggest single-month trade deficit on record in August as imports surged on high energy costs and a slump in the yen, exposing the economy’s vulnerability to external price pressures. The growing trade deficit highlights a key issue with Japan’s policy of achieving export growth with a weaker currency. Imports jumped 49.9% in the year to August, driven by costs of crude oil, coal and liquefied natural gas (LNG), and causing the trade deficit to swell to 2.8173 trillion yen ($19.71 billion), the biggest shortfall on record. The gain in imports was bigger than a median market forecast for a 46.7% rise and outstripped a 22.1% year-on-year increase in exports in the same month, Ministry of Finance data showed.
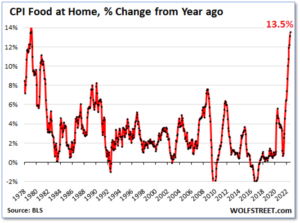
Finally: Analyst Wolf Richter at wolfstreet.com did a deep dive into the details of this week’s inflation report and what he found wasn’t pretty. While the headline CPI and even the core CPI weren’t worse than expected, Richter found that the CPI for ‘services’ was a “nightmare”, which “spiked relentlessly” to its highest increase since October of 1982. Services make up the vast majority of the U.S. economy and are now the main driver of inflation. A part of CPI is the large “food at home” category, which spiked to its worst level since February of 1979 at 13.5%. Food inflation is particularly worrisome because it hits low and middle-income households the most since they spend a relatively bigger part of their budgets on food. (Chart from wolfstreet.com)
(Sources: All index- and returns-data from Yahoo Finance; news from Reuters, Barron’s, Wall St. Journal, Bloomberg.com, ft.com, guggenheimpartners.com, zerohedge.com, ritholtz.com, markit.com, financialpost.com, Eurostat,0020Statistics Canada, Yahoo! Finance, stocksandnews.com, marketwatch.com, wantchinatimes.com, BBC, 361capital.com, pensionpartners.com, cnbc.com, FactSet.) Content provided by WE Sherman and Company. Securities offered through Registered Representatives of Cambridge Investment Research Inc., a broker-dealer, member FINRA/SIPC. Advisory Services offered through Cambridge Investment Research Advisors, a Registered Investment Adviser. Strategic Investment Partners and Cambridge are not affiliated. Indices mentioned are unmanaged and cannot be invested into directly. Past performance is no guarantee of future results. These opinions of Strategic Investment Partners and not necessarily those of Cambridge Investment Research, are for informational purposes only and should not be construed or acted upon as individualized investment advice.